HOW-TO GUIDE
How to Measure the Amplitude of a Noisy Signal With an Oscilloscope
By the OhmSavvy Research Team ·
Before you start
- Fix setup-side noise first. A long ground lead or a ground loop can add more fuzz than the circuit does; work through why an oscilloscope waveform looks noisy so you are measuring the signal, not your probing.
- On mains-derived or high-voltage circuits, keep the ground clip on a true ground reference and never defeat the scope's earth connection to quieten a trace.
Why Vpp overstates the amplitude of a noisy signal
Automatic peak-to-peak is the simplest measurement a scope makes: the highest sample minus the lowest. Noise doesn't average out of that calculation; it sets both ends of it. For random noise the extremes sit roughly three standard deviations either side of the true level, so a 1 V square wave carrying 20 mV RMS of noise can read somewhere near 1.1 V. The longer the record, the more chances a rare spike has to land in it, which is why Vpp keeps drifting upward when you leave the scope running.
1Use the Vamp (amplitude) measurement instead of Vpp
Most digital scopes offer both Vpp and Vamp (sometimes called Amplitude). For Vamp, the scope builds a histogram of sample voltages and picks the most populated level in the upper half as the top and in the lower half as the base. Noise spreads each level into a hump, but the center of the hump stays put, so top minus base lands close to the real step height. The same method also ignores overshoot and ringing at the edges.
Vamp works best on signals with flat levels: square waves, logic and pulses. A sine has no flat top, so many scopes fall back to the maximum and minimum and Vamp behaves much like Vpp. For sines, use averaging or the RMS method below.
2Average a repetitive signal (with a stable trigger)
Average acquisition mode adds up many triggered captures point by point and divides by the count. Anything that repeats identically from one trigger to the next survives; random noise, which differs every time, shrinks roughly with the square root of the number of captures.
Two conditions decide whether averaging helps. The signal must repeat, and every capture must line up at the same point. If noise makes the trigger fire early or late, edges smear and the averaged amplitude shrinks. Set the trigger level at mid-amplitude, and use HF reject or noise reject trigger coupling if your scope has it. Our guide on how to trigger an oscilloscope covers level and coupling in detail.
3High-res mode and the 20MHz bandwidth limit
When the signal does not repeat, or the trigger cannot be made steady, filter instead. High-res mode averages neighboring samples inside one capture, and the 20MHz bandwidth limit found on many bench scopes removes content above that frequency. Both are low-pass filters: they quieten the trace in a single shot, but anything fast in your signal is filtered too.
The safe test is to toggle the filter and watch the amplitude reading. If only the fuzz gets thinner, keep it on. If Vamp itself drops or edges visibly round off, the filter is cutting into the signal. The oscilloscope bandwidth explainer shows how attenuation rises near a cutoff frequency.
4Measure RMS and subtract the noise
Uncorrelated noise adds to a signal in quadrature, so RMS values combine as a square root of a sum of squares. That gives you a way to remove the noise mathematically. Measure the AC RMS of the noisy signal, then turn off the source (or probe the same node with the signal stopped) and measure the RMS of what is left. The signal's own RMS is the square root of the difference of the squares.
| Step | Worked example (illustrative values) |
|---|---|
| Total AC RMS, signal on | 150 mV |
| Noise RMS, signal off | 90 mV |
| Signal RMS = √(150² − 90²) | √(22,500 − 8,100) = 120 mV |
| For a sine: peak = RMS × 1.414 | ≈ 170 mV peak, ≈ 339 mV peak-to-peak |
This is most useful when noise is a large share of the reading, as in the example. When noise is small, the correction barely changes the answer. The noise measurement itself is the subject of how to measure noise floor with an oscilloscope.
5Place cursors on the averaged trace
Automatic measurements can still misjudge a waveform with slow edges or a sloping top. Once averaging has produced a clean trace, switch on horizontal (voltage) cursors and place them on the settled top and base, away from the edges. The cursor delta is your amplitude, and you can see exactly which part of the waveform it refers to.
6Read the mean over many acquisitions with statistics
A single capture gives one sample of a noisy measurement. Turn on measurement statistics and the scope shows the current value alongside the mean, minimum, maximum and standard deviation over every acquisition since you reset it. Let it run for a few hundred acquisitions, then quote the mean.
Mean of Vamp, not mean of Vpp
The basics of each automatic voltage reading are covered in how to measure voltage with an oscilloscope.
Which method to use for a noisy signal amplitude
| Situation | Best approach | Watch out for |
|---|---|---|
| Repeating square wave or logic | Vamp, ideally on an averaged trace | Trigger jitter shrinking the average |
| Repeating sine | Averaging, then Vpp or cursors | Vamp behaving like Vpp |
| One-shot or non-repeating | High-res or bandwidth limit, then Vamp | Filtering away real fast detail |
| Noise comparable to the signal | RMS with noise subtracted | Noise that is not random, such as switching spikes |
| Any of the above | Statistics mean over many acquisitions | Quoting a single capture |
Any digital scope with average acquisition and automatic measurements can do this. Extra bandwidth is no help here; a lower noise floor and good statistics are. Compare models in the best beginner oscilloscopes roundup.
Bench scopes in our reviews
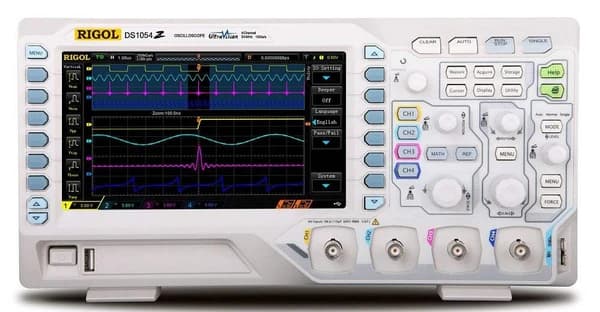
50MHz, 4 channels, 1 GSa/s. Large 7-inch display and strong community documentation.
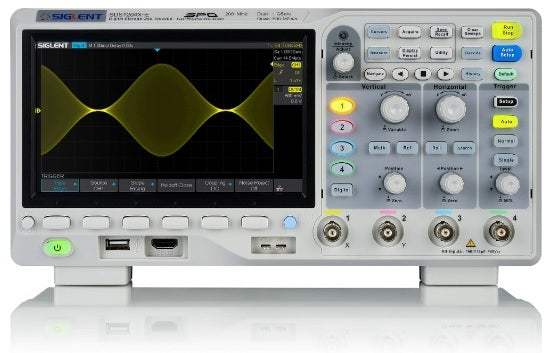
100MHz, 4 channels, 1 GSa/s, with a well-regarded user interface.
As an Amazon Associate I earn from qualifying purchases. Prices and availability are shown on Amazon.
Frequently asked questions
Why is my oscilloscope Vpp reading higher than the signal really is?
Peak-to-peak takes the single highest and lowest samples on screen. When random noise rides on the signal, those extremes are noise peaks, so the reading includes the signal plus roughly the noise's own peak-to-peak height. It also creeps up the longer you watch, because rarer spikes keep turning up. Use Vamp or an averaged trace instead.
What is the difference between Vamp and Vpp on an oscilloscope?
Vpp is maximum minus minimum, so it includes overshoot, ringing and noise peaks. Vamp is top minus base, where top and base are the most common high and low levels found from a histogram of the samples. On a clean square wave they are nearly equal; on a noisy or ringing one, Vamp is the closer estimate of the real step size.
How many averages should I use?
Random noise falls roughly with the square root of the number of averages, so 16 averages cut it to about a quarter and 64 to about an eighth. Beyond that the gains are slow and the display responds sluggishly to changes. Start at 16 or 32, increase only if the trace is still fuzzy, and keep the trigger stable throughout.
Does the bandwidth limit change the amplitude I measure?
Not for signals well below the filter's cutoff, which is why it is safe on audio, sensor and slow logic signals. Near or above the cutoff, the filter attenuates the signal itself and rounds square-wave edges, so the reading drops. Compare the reading with the limit on and off: if only the fuzz changes, the filter is not affecting your signal.
Can I measure the amplitude of a noisy one-shot signal?
Yes, but not with averaging, which needs the same waveform to repeat. For a single event, use high-res mode or the bandwidth limit to reduce noise within the one capture, then measure Vamp or place cursors through the middle of the noise band. Quote the result with an uncertainty roughly equal to the remaining noise.