HOW-TO GUIDE
What Is Oscilloscope Bandwidth?
By the OhmSavvy Research Team ·
The -3 dB definition, in plain numbers
Every oscilloscope input behaves like a low-pass filter. Slow signals pass through at full size; as frequency rises, the amplifiers, input capacitance and probe start to attenuate them. Manufacturers define bandwidth as the frequency where a sine wave is reduced by 3 decibels. In voltage terms, -3 dB is a factor of 1/√2, or about 0.707.
So if you feed a 6 V peak-to-peak sine into a scope at exactly its rated bandwidth, the screen shows roughly 4.24 V peak-to-peak. That is an error of about 29%, not a small rounding issue. Bandwidth is not the frequency where measurements are still accurate; it is the frequency where they have already gone noticeably wrong.
Signals above the bandwidth are not cut off like a wall. They keep shrinking as frequency rises, which is why a scope can still show something at twice its rated bandwidth, just too small and too distorted to trust.
Why the 3-5x rule exists
Because the response starts rolling off well before the -3 dB point, the buying guide rule of thumb is to choose a bandwidth 3-5x higher than the highest frequency you care about. The exact error depends on the shape of each scope's frequency response, but for the typical gentle roll-off of a general-purpose scope the figures land roughly here:
| Signal frequency vs. bandwidth | Approximate amplitude shown | Approximate error |
|---|---|---|
| Equal to bandwidth (1x) | 70.7% | about 29% low |
| Half the bandwidth (2x margin) | 89-92% | about 8-11% low |
| One-third of bandwidth (3x margin) | 95-96% | about 4-5% low |
| One-fifth of bandwidth (5x margin) | 98-99% | about 1-2% low |
The ranges cover two common textbook response shapes (single-pole and Gaussian); a real scope sits somewhere near them, so treat these as orders of magnitude rather than datasheet values. The pattern is the point: a 3x margin keeps amplitude error to a few percent, and 5x makes it small enough to ignore for most bench work.
The chart below plots both models. They agree exactly at 1x, where each reads 70.7%, and differ by only a few percent elsewhere: about 89% and 92% at half the bandwidth, 95% and 96% at one-third, and 98% and 99% at one-fifth. Notice how early the single-pole curve leaves the 100% line; that early droop is the reason for the margin.
Square waves: bandwidth is really about edges
A sine wave contains a single frequency. A square wave does not: mathematically it is a fundamental plus odd harmonics at 3x, 5x, 7x and so on, each smaller than the last. Those harmonics are what make the edges sharp. A 10MHz clock has components at 30MHz, 50MHz, 70MHz and beyond. On a 50MHz scope the 3rd harmonic is already attenuated and the 5th is at the -3 dB point, so the square wave appears with rounded corners and sloped edges even though its 10MHz fundamental is comfortably inside the spec.
This is why the common starting point for digital signals is a bandwidth of at least 5x the clock frequency, which passes the fundamental, the 3rd harmonic and (at -3 dB) the 5th. If you care about the edge itself, the better approach is to think in rise time.
Rise time ≈ 0.35 / bandwidth
A scope's own rise time (10% to 90%) is linked to its bandwidth. For most scopes below about 1GHz, which have a gently rolling response, the standard approximation is rise time ≈ 0.35 / bandwidth. Some higher-bandwidth scopes with a flatter, sharper roll-off use a factor nearer 0.4-0.45, so check the datasheet if you need precision.
| Scope bandwidth | Example | Scope rise time (0.35/BW) |
|---|---|---|
| 200kHz | FNIRSI DSO152 | 1.75 µs |
| 50MHz | Rigol DS1054Z | 7 ns |
| 100MHz | Siglent SDS1104X-E, Hantek DSO2D10 | 3.5 ns |
| 200MHz | General example | 1.75 ns |
When you measure an edge, the rise time you see is roughly the root-sum-of-squares of the signal's real rise time and the scope's rise time. A worked example with a signal whose true rise time is 10 ns:
- On a 50MHz scope (7 ns): √(10² + 7²) = √149 ≈ 12.2 ns displayed, about 22% slower than reality.
- On a 100MHz scope (3.5 ns): √(10² + 3.5²) = √112.25 ≈ 10.6 ns displayed, about 6% slow.
Rule of thumb for edges
The rest of the chain: probes and settings
The bandwidth on the front panel is the scope alone. What you actually get is limited by everything between the circuit and the screen:
Probe bandwidth
Every probe has its own rating. A probe rated below the scope caps the whole system at the lower figure.
1x vs 10x
In 1x mode a passive probe's bandwidth is usually far lower than in 10x mode. Check the probe's spec for both.
Bandwidth limit
Many scopes have a bandwidth-limit setting (20MHz is common) to cut noise. Left on by accident, it rounds every fast edge.
Long ground leads
A long ground clip adds inductance that causes ringing on fast edges, which can look like a signal fault.
Compensation
An uncompensated probe distorts square waves regardless of bandwidth. Compensate it before judging edges.
More is noisier
Extra bandwidth also lets more high-frequency noise through, one reason the limit setting exists at all.
Probe compensation in particular is easy to miss; the steps are in how to compensate an oscilloscope probe.
How much bandwidth do you need?
Work out the highest frequency that matters in your signal, then apply the margin. For sines, that is the signal frequency; for digital and square signals, start from 5x the clock.
| Signal | Frequency that matters | Suggested bandwidth |
|---|---|---|
| Audio sine, 20kHz | 20kHz | 60-100kHz or more |
| Sine, 100kHz | 100kHz | 300-500kHz |
| Sine, 10MHz | 10MHz | 30-50MHz |
| 1MHz clock or square wave | 5MHz (to 5th harmonic) | 5MHz minimum, more for clean edges |
| 10MHz clock or square wave | 50MHz (to 5th harmonic) | 50MHz minimum, 100MHz for more margin |
The four scopes in our comparison span a wide range. The FNIRSI DSO152's 200kHz is 250 times lower than the Rigol DS1054Z's 50MHz, and the two 100MHz models double the Rigol again:
Bars use a logarithmic scale: each step is ten times the last.
Applied to real models: the FNIRSI DSO152's 200kHz bandwidth suits audio-range and slow control signals, but a 100kHz sine is already at half its bandwidth and will read noticeably low. The Rigol DS1054Z at 50MHz keeps amplitude error small on sines up to roughly 10-17MHz (the 5x and 3x margins) and shows a 10MHz clock with softened edges. The 100MHz Siglent SDS1104X-E and Hantek DSO2D10 double that headroom and halve the scope's own rise time. For most hobby microcontroller, audio and power work, 50-100MHz is enough, which is why the beginner picks cluster there.
Scopes discussed on this page
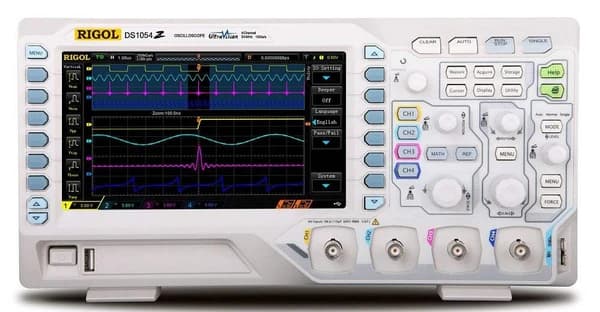
50MHz, 4 channels, 1 GSa/s, 7-inch display, with strong community documentation.
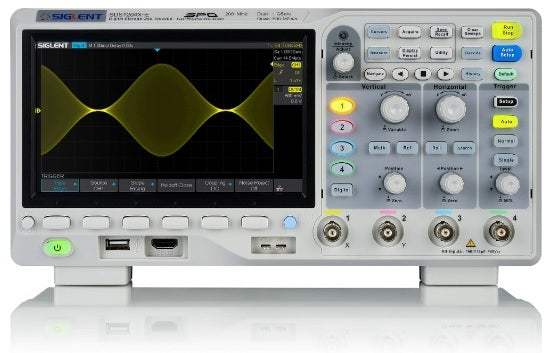
100MHz, 4 channels, 1 GSa/s: twice the Rigol's bandwidth.
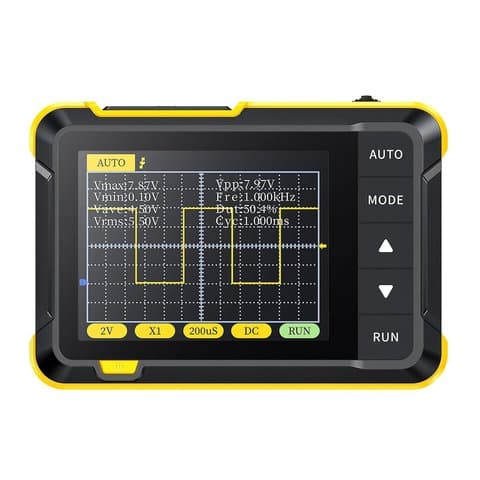
As an Amazon Associate I earn from qualifying purchases. Prices and availability are shown on Amazon.
Bandwidth is half the story
A front end with plenty of bandwidth still needs enough samples to draw the waveform. That second limit is the sample rate, covered in what GSa/s means on an oscilloscope. If you are new to scopes altogether, start with what an oscilloscope is and how to read the screen, then check amplitude yourself with how to measure voltage with an oscilloscope.
Frequently asked questions
Is a 50MHz oscilloscope enough for a beginner?
For most hobby microcontroller, audio and power work, yes. A 50MHz scope keeps amplitude error small on sines up to roughly 10-17MHz and shows a 10MHz clock, just with softened edges. Its own rise time is about 7 ns, so it is not the right tool for timing very fast edges, but slow serial buses, PWM and audio signals sit far inside its range.
What happens if a signal is above the oscilloscope's bandwidth?
The scope does not block it. The signal keeps getting smaller as its frequency rises past the -3 dB point, so you may still see a trace at twice the rated bandwidth, only shrunken and distorted. A square wave whose harmonics fall above the bandwidth loses its sharp corners and starts to look rounded, closer to a sine than to the real waveform.
Can a probe reduce oscilloscope bandwidth?
Yes. What you measure is limited by the whole system, not just the scope. A probe rated below the scope caps the result at the probe's figure, and a passive probe in 1x mode usually has far less bandwidth than in 10x mode. A long ground lead adds ringing on fast edges, and an uncompensated probe distorts square waves whatever the bandwidth.
How do you calculate oscilloscope bandwidth from rise time?
For typical scopes below about 1GHz, bandwidth is roughly 0.35 divided by rise time, and rise time is roughly 0.35 divided by bandwidth. A 7 ns rise time corresponds to about 50MHz, and 3.5 ns to about 100MHz. To measure an edge accurately, choose a scope whose own rise time is 3-5x faster than the edge you want to see.
Does more bandwidth make an oscilloscope better?
Only if your signals need it. Extra bandwidth improves accuracy on fast sines and sharp edges, but it also lets more high-frequency noise reach the screen, which is why many scopes offer a bandwidth-limit setting. If your highest frequency of interest is already below a fifth of the rated bandwidth, more bandwidth changes very little about the readings you take.
