HOW-TO GUIDE
How to Measure Noise Floor With an Oscilloscope
By the OhmSavvy Research Team ·
Rails, grounds and mains
- Only measure low-voltage secondary rails this way. A probe ground clip is earthed through the scope, so never connect it to anything on the mains side of a power supply.
What noise floor means on an oscilloscope
Noise is the random, broadband variation sitting on every real signal. An oscilloscope adds its own: its input amplifier generates some, the analogue-to-digital converter rounds each sample to a finite step, and the probe and its ground lead pick up fields from nearby equipment. The noise floor is the smallest variation you can measure before the instrument's contribution dominates. If a circuit's noise reads close to the floor, the honest answer is "at or below what this setup can see".
1Measure the scope's own noise first
- Disconnect the signal. Either fit a BNC terminator or shorting cap to the channel, or attach the probe you will use and clip its tip to its own ground with the spring tip.
- Choose DC coupling and the most sensitive V/div the channel offers.
- Set the same timebase and sample rate you plan to use on the circuit.
- Use Auto trigger mode, since there is no edge to trigger on.
- Add AC RMS (or RMS) and peak-to-peak measurements and turn on statistics.
- Repeat with the bandwidth limit on and off, and at each V/div you expect to use.
Write the results down. The figure with the probe attached is the one that applies to real measurements.
2Peak-to-peak vs RMS noise
RMS describes the noise's typical size and settles to a steady number quickly. Peak-to-peak describes its worst excursions, and for random noise it keeps growing slowly as you collect more samples, because rarer large peaks keep arriving. For noise with a Gaussian distribution, a common rule of thumb is that Vpp ≈ 6 × RMS, since about 99.7% of samples fall within ±3σ.
| Vpp as a multiple of RMS | Share of Gaussian samples inside that window |
|---|---|
| 4 × RMS (±2σ) | About 95.4% |
| 6 × RMS (±3σ) | About 99.7%: the usual rule of thumb |
| 6.6 × RMS (±3.3σ) | About 99.9% |
| 8 × RMS (±4σ) | About 99.994% |
If your measured Vpp is far more than six times the RMS, the noise is probably not random: look for spikes from switching edges or bursts from a radio or motor.
3Use the 20MHz bandwidth limit, and say so
For broadband noise, the RMS value grows roughly with the square root of the bandwidth you measure over. Turning on the 20MHz limit that most bench scopes offer therefore lowers the reading noticeably on a 100MHz scope. The chart shows the textbook relationship for flat (white) noise; real noise spectra are rarely perfectly flat, so treat it as a guide.
A noise figure without its bandwidth is meaningless, so always record it. Our oscilloscope bandwidth guide explains how the front end rolls off.
41x vs 10x probes: why the ratio changes the floor
The scope's channel noise is a fixed amount of voltage at the BNC connector. A 10x probe divides the signal by ten before it gets there, and the scope multiplies the display back up by ten, so the channel's own noise is multiplied by ten too when referred to the probe tip.
The trade-off
5Replace the ground clip with a spring tip
The standard ground lead forms a loop several centimeters across, and that loop behaves like an antenna for magnetic fields from switching regulators, transformers and motors. A spring ground tip shrinks the loop to almost nothing. To check, short the probe tip to the spring tip right next to the circuit while it runs: anything that still appears is pickup, and it sets your practical floor.
Averaging vs high-res mode
Both reduce noise on screen, in different ways, and both change what you are measuring:
| Mode | What it does to noise |
|---|---|
| Average | Combines many triggered captures. Random noise averages towards zero, so it all but disappears. Useful to reveal a repeating signal; useless for measuring noise. |
| High-res | Averages neighboring samples within one capture. Acts like a low-pass filter, lowering both noise and effective bandwidth. |
| Normal | Raw samples. Use this for noise floor measurements. |
Measure a power rail's noise with an oscilloscope
- Probe across the output capacitor nearest the load, with the spring tip on its ground pad.
- Switch to AC coupling so you can use a sensitive V/div despite the DC level.
- Turn on the 20MHz limit unless you need to see higher frequencies.
- Read AC RMS and Vpp with statistics, over a capture long enough to include several ripple cycles.
If the rail reading is close to the floor, subtract in quadrature: a 3 mV RMS rail reading over a 1 mV RMS floor implies about √(3² − 1²) ≈ 2.8 mV RMS from the circuit. For DC levels and the basics of reading a trace in volts, see how to measure voltage with an oscilloscope.
Ripple vs noise: two different measurements
On a supply rail the two overlap, but they are not the same thing. Ripple is periodic, locked to the mains or switching frequency, so you can trigger on it and it looks the same on every sweep. Noise is random and broadband; it never repeats and cannot be triggered on. Measure ripple with a timebase that shows a few cycles, and noise as RMS over a defined bandwidth. Our guide to measuring ripple voltage with an oscilloscope covers the periodic part in depth.
Which oscilloscope you need for noise work
A bench scope with a sensitive lowest V/div range, a 20MHz bandwidth limit and RMS measurements with statistics covers most rail-noise work. Check the datasheet for the lowest V/div and any published noise figure before buying, and compare models in our best beginner oscilloscopes roundup.
Bench scopes in our reviews
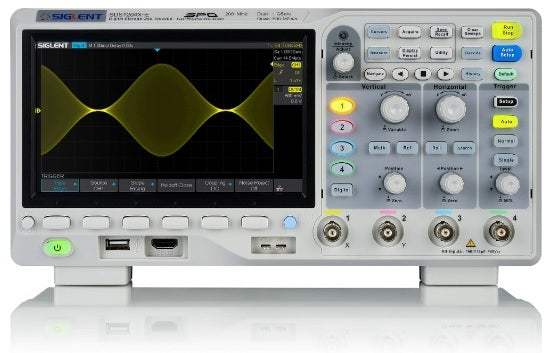
50MHz, 4 channels, 1 GSa/s. Our best overall pick for hobbyists and students.
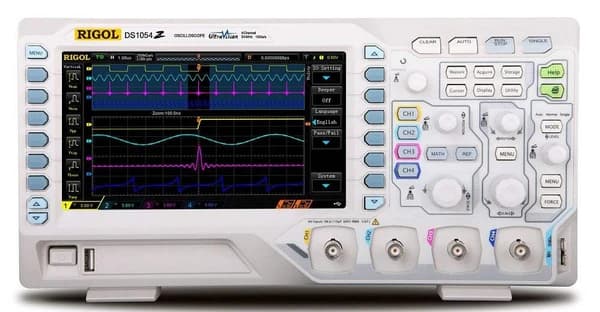
100MHz, 4 channels, 1 GSa/s, with more bandwidth headroom than entry-level scopes.
As an Amazon Associate I earn from qualifying purchases. Prices and availability are shown on Amazon.
Frequently asked questions
What is a typical oscilloscope noise floor?
It depends on the model, the V/div setting and the bandwidth, which is why measuring your own is worthwhile. Some manufacturers publish a noise figure in their datasheets, usually at the most sensitive range and full bandwidth. Expect the floor in volts to be lowest on the most sensitive settings and to rise when you switch to coarser V/div ranges.
Should I measure noise in RMS or peak-to-peak?
Record both and say which bandwidth you used. RMS is stable and repeatable, so it is the better number for comparing setups. Peak-to-peak is what matters when noise could push a signal across a logic threshold or an ADC's input, but it keeps growing the longer you watch, so note the capture length or the number of acquisitions.
Why does my scope show noise with nothing connected?
Every scope front end has amplifier noise, and its analogue-to-digital converter adds quantisation steps, so a trace is never perfectly flat at sensitive settings. An open input also picks up stray fields from the room. Fit a terminator or short the probe to its own ground; what remains is the scope's genuine floor rather than pickup.
Does the bandwidth limit hide real noise?
It removes noise above the limit, so yes, by design. For power rails feeding typical digital and analogue parts, content above 20MHz is usually filtered by the load's own decoupling, and many power supply datasheets specify noise in a 20MHz bandwidth. If your circuit is sensitive at higher frequencies, measure with the limit off as well and report both.
How do I subtract the scope's noise from my measurement?
Random noise sources add as the square root of the sum of squares, not directly. Square the RMS value you measured on the circuit, subtract the square of the scope's own RMS floor at the same settings, and take the square root. This only works for RMS values and only when the circuit's noise is not far below the scope's floor.