HOW-TO GUIDE
How to Measure Frequency With an Oscilloscope
By the OhmSavvy Research Team ·
Measuring mains frequency? Read this first
- Checking 50 Hz or 60 Hz mains is a common reason to reach for a scope, and the most dangerous. On a mains-powered bench scope, the probe's ground clip is normally tied to mains earth through the power cord. Clipping it to a point that isn't at earth potential, such as neutral, live or anything inside a non-isolated mains circuit, creates a short through the ground lead that can wreck the probe and scope, start a fire or injure you.
- Never remove or defeat the scope's earth connection ("floating" it) to get around this. Use an isolation transformer on the device under test, a differential probe, or an isolated-channel or handheld scope rated for mains work.
- Standard 1x/10x passive probes are not for mains unless their voltage and CAT rating explicitly cover it; check the ratings on both the probe and the scope input. For low-voltage practice, measure the scope's own calibration output or a microcontroller pin instead.
How to measure mains frequency with an oscilloscope walks through the safe low-voltage adaptor method step by step.
Period and frequency: the one formula you need
A repeating signal's period (T) is the time from one point on the waveform to the same point on the next cycle, for example rising edge to rising edge. Frequency is how many of those cycles happen per second, so the two are reciprocals.
f = 1 / T
The whole manual method comes down to three moves, shown below with the numbers from the square wave in step 2: count the divisions in one cycle, multiply by the time/div setting to get the period, then take the reciprocal.
01
Count divisions
Rising edge to rising edge: 4 div
02
× time/div = T
4 × 0.5 ms = 2 ms period
03
f = 1 / T
1 ÷ 2 ms = 500 Hz
1Get a stable trace with a few cycles on screen
Connect the probe (10x, with the channel set to 10x), press Autoset if your scope has it, and set the trigger on a clean edge so the waveform stands still. If you are new to these controls, start with how to use an oscilloscope and how to trigger one.
Then turn the time-per-division (time/div) knob until you can see roughly two to five complete cycles. Fewer than one full cycle and you can't measure a period at all; dozens of cycles and each one is too narrow to read accurately.
2Count the divisions in one period
Pick two matching points one cycle apart. Edges that cross the center line are the easiest to locate precisely, because the trace is steepest there. Count the horizontal divisions between them, using the minor ticks (each 0.2 division on most scopes) for the fractional part. The standard grid is 10 divisions wide; our guide to reading an oscilloscope screen explains the graticule in detail.
3Multiply by time/div, then take the reciprocal
Period = divisions × time/div. Frequency = 1 ÷ period. Watch the units: the time/div setting may be in seconds, milliseconds, microseconds or nanoseconds, and that is where most arithmetic slips happen.
More worked examples:
| Time/div | Divisions per period | Period (T) | Frequency (1/T) |
|---|---|---|---|
| 1 ms/div | 4 | 4 ms | 250 Hz |
| 0.5 ms/div | 4 | 2 ms | 500 Hz |
| 0.2 ms/div | 5 | 1 ms | 1 kHz |
| 10 µs/div | 2.5 | 25 µs | 40 kHz |
| 1 µs/div | 3.2 | 3.2 µs | 312.5 kHz |
4Measure several periods for a better answer
Reading the grid by eye, you can typically place an edge to within about one minor tick (0.2 division). On a 4-division period that is a possible error of around 5%. Spread the same uncertainty over a longer span and it shrinks: measure the time across several complete cycles and divide by the number of cycles.
Worked example: at 0.5 ms/div you see 4 complete cycles spanning 8 divisions. That is 8 × 0.5 ms = 4 ms for 4 cycles, so T = 4 ms ÷ 4 = 1 ms and f = 1 kHz. The 0.2-division reading uncertainty is now spread over 8 divisions instead of 2, so the error is about a quarter as large.
Notice that the screen holds five full cycles, but the measurement uses only four of them. Pick a whole number of cycles whose start and end both land on clear crossings, and ignore any partial cycle at the edge of the screen.
5Check it with cursors and auto measurements
Digital scopes give you two faster and more precise ways to get the same number:
Time cursors
Two vertical lines (often called X or time cursors) placed on matching edges. The scope shows ΔT, and many also show 1/ΔT as a frequency.
Auto frequency
The measurement menu calculates frequency and period from the captured waveform and updates it live.
Frequency counter
Some scopes include a separate counter readout. Whether yours has one varies by model; check the manual.
Cursors are best when you want the period of one specific part of a signal. Auto measurements are best for a steady, repeating signal. If the manual count, the cursors and the auto readout all roughly agree, you can trust the result. If they don't, one of the problems below is usually to blame.
Common frequency measurement errors
| Symptom | Likely cause | Fix |
|---|---|---|
| Auto frequency jumps around or shows nothing | Noise causing false edges, or less than one full cycle on screen | Show 2-5 cycles; stabilize the trigger; try the bandwidth limit if your scope has one |
| Reading is about double the real value | Noise or ringing counted as extra edges, or a period measured edge to opposite edge | Measure rising edge to rising edge; check the trace for ringing |
| Waveform looks slow and stable but the frequency is wrong | Aliasing: the sample rate is too low for the signal at this time/div | Use a faster time/div setting and check the result changes as expected |
| Answer off by a factor of 1,000 | Unit slip between ms, µs and ns | Write the time/div unit down before you calculate |
Aliasing deserves a closer look. A digital scope samples the signal, and if it samples fewer than two times per cycle (the Nyquist limit) it can show a convincing but false, lower frequency. On slow time/div settings some scopes reduce the sample rate, which makes this easier to trigger. Our explainer on what GSa/s means covers sample rate in detail.
How accurate is an oscilloscope's frequency reading?
The scope's internal timebase is usually far more accurate than its vertical (voltage) system; timebase accuracy is typically specified in parts per million on the datasheet. In practice, how well you place the edges, by eye or with cursors, limits a manual reading far more than the timebase does.
Bandwidth also sets a ceiling. A scope can only display signals it can pass, and signals approaching its rated bandwidth are attenuated and lose their edge shape. As a rule of thumb, pick a scope with 3-5x the bandwidth of the highest frequency you care about. See what oscilloscope bandwidth means. Many multimeters also have a frequency (Hz) mode, which is handy for a quick number on a clean signal; our oscilloscope vs multimeter guide explains when that is enough and when you need to see the waveform.
Picking a scope for frequency work
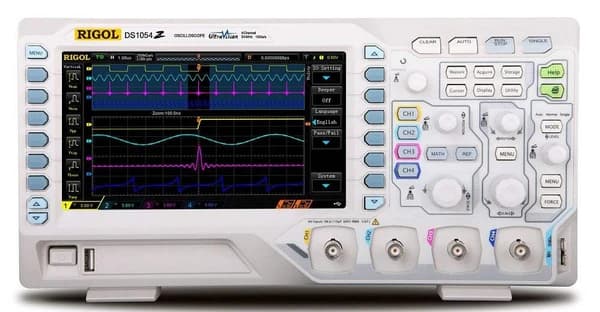
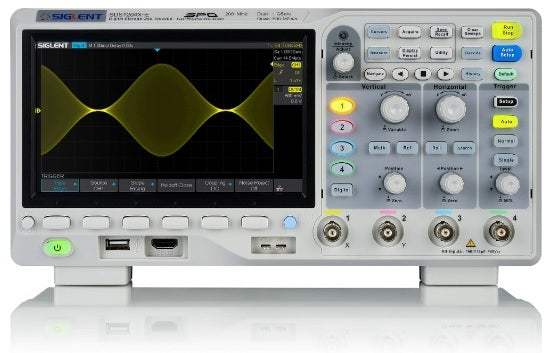
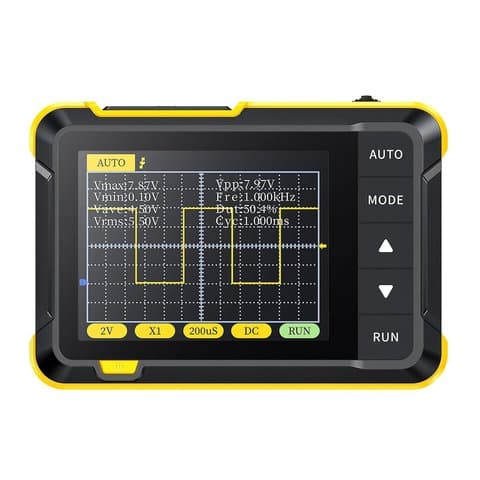
The FNIRSI DSO152 (200kHz bandwidth, 2.5 MSa/s) is suited to audio-range and slower signals; see the DSO152 review. For microcontroller clocks, PWM and serial signals, a bench scope such as the Rigol DS1054Z (50MHz, 1 GSa/s), Hantek DSO2D10 (100MHz, 1 GSa/s) or Siglent SDS1104X-E (100MHz, 1 GSa/s) gives far more headroom. Compare them in our best beginner oscilloscopes list or the oscilloscope buying guide. If you're still deciding whether you need a scope at all, read what an oscilloscope is, and if you want to practice on a known signal, the Hantek DSO2D10's built-in waveform generator can supply one.
Scopes in our reviews
As an Amazon Associate I earn from qualifying purchases. Prices and availability are shown on Amazon.
Frequently asked questions
Can an oscilloscope measure frequency automatically?
Yes. Most digital scopes have a measure menu that calculates frequency and period from the captured waveform and updates the value live. It works best on a clean, steady signal with a stable trigger and at least one full cycle on screen, ideally two to five. It is still worth checking the number once by counting divisions, so you know the reading makes sense.
How do you convert time per division to frequency?
Multiply the number of horizontal divisions in one cycle by the time/div setting to get the period, then divide 1 by the period. For example, 2.5 divisions at 10 µs/div is a 25 µs period, and 1 / 25 µs = 40 kHz. Keep the units paired: a period in milliseconds gives kilohertz, and a period in microseconds gives megahertz.
Why does my oscilloscope show double the real frequency?
Usually edges were counted that are not one full cycle apart. Noise or ringing near the measurement level can register as extra edges, and measuring from a rising edge to the next falling edge gives only half a period on a square wave. Measure rising edge to rising edge, keep two to five clean cycles on screen and stabilize the trigger.
Can a multimeter measure frequency instead of an oscilloscope?
Many multimeters have a frequency (Hz) mode that gives a quick number on a clean, repeating signal. What a meter cannot show is the waveform, so it cannot tell you whether the signal is noisy, distorted or ringing, all of which can upset the count. Use the meter for a quick check and the scope when the shape matters or the reading looks wrong.
What frequency can a 50MHz oscilloscope measure?
Bandwidth is the frequency at which a sine wave is shown at about 70.7% of its true amplitude, so a 50MHz scope can still display a 50MHz signal, just attenuated and with rounded edges. For readings where shape and amplitude are trustworthy, the 3-5x rule of thumb puts the comfortable limit at roughly 10 to 17 MHz.
