HOW-TO GUIDE
How to Measure a Square Wave With an Oscilloscope
By the OhmSavvy Research Team ·
Safety first: the ground clip connects to mains earth
- On a mains-powered bench scope, the probe's ground clip is tied to mains earth through the power cord. Clip it only to the circuit's ground, such as a logic board's GND pin. Clipping it to a point at another voltage shorts that point to earth.
- Square waves inside switching power supplies and motor drives are often not referenced to earth, and on the primary side they sit at mains potential. Use a rated differential probe or an isolation transformer on the device under test. Never float the scope by defeating its earth connection.
1Check the probe on a known square wave first
A square wave is the most demanding everyday signal for a probe, because each edge contains energy at many frequencies at once. A 10x passive probe has a small trimmer capacitor that must be matched to the scope input. If it isn't, low and high frequencies are attenuated by different amounts and the flat tops come out sloped, spiked or rounded, even though the real signal is fine. That is why scopes have a square-wave calibration output, and why you should clip onto it before measuring anything with sharp edges.
The full adjustment takes a couple of minutes and is covered in how to compensate an oscilloscope probe. While you are there, make sure the channel's probe setting matches the probe switch (1x or 10x) and that the channel is DC coupled. AC coupling makes the tops of a slow square wave droop and moves the trace when the duty cycle changes, as explained in why an oscilloscope waveform shifts vertically.
2Get a stable trace with two or three cycles
Set edge triggering on the rising edge and put the trigger level at roughly the middle of the swing, about 2.5 V for a 0–5 V signal. Then turn the time/div knob until two or three full cycles fill the screen, and the V/div knob until the swing uses most of the 8 vertical divisions. If the trace still rolls or doubles up, our guide to triggering an oscilloscope covers the usual fixes. Two cycles on screen is the sweet spot: enough to see a whole period, but zoomed in far enough that each division is worth a small amount of time.
3Read the high level, low level and amplitude
With DC coupling, every level is read from the channel's ground marker, the small arrow at the left edge of the screen. In the example below the ground marker has been moved 2 divisions below the center line so the whole 5 V swing fits at 1 V/div. Count divisions from the marker to the flat bottom (the low level) and to the flat top (the high level), then multiply by V/div.
Amplitude is simply high minus low: 5 V − 0 V = 5 V. Read the levels on the flat parts of the waveform, not on the corners, because any overshoot at the edges is a separate feature with its own measurement (see how to measure overshoot and ringing). A real logic signal rarely sits exactly at 0 V and its supply voltage; a high level a little below the rail under load is normal, and the exact output levels are in the driving chip's datasheet. For more on reading levels, see how to measure voltage with an oscilloscope.
4Measure the period and frequency
The period (T) is the time from one rising edge to the next. Measure it where the edges cross the 50% level, because that point is least affected by edge speed. In the figure above the rising edges sit 5 divisions apart at 0.2 ms/div, so T = 5 × 0.2 ms = 1 ms and the frequency is f = 1 ÷ T = 1 ÷ 1 ms = 1 kHz.
| Measurement | How to read it | Example (figure above) |
|---|---|---|
| High level | Ground marker to flat top × V/div | 5 div × 1 V = 5 V |
| Low level | Ground marker to flat bottom × V/div | 0 div = 0 V |
| Amplitude | High level − low level | 5 V − 0 V = 5 V |
| Period (T) | Rising edge to next rising edge × time/div | 5 div × 0.2 ms = 1 ms |
| Frequency (f) | 1 ÷ T | 1 ÷ 1 ms = 1 kHz |
| Duty cycle | High time ÷ period × 100% | 2.5 div ÷ 5 div = 50% |
For a more precise number, spread several periods across the screen and divide, or use cursors. The full method is in how to measure frequency with an oscilloscope.
5Check the duty cycle
A true square wave is high for exactly half of each period, 50% duty. Many signals that look square are not, and a clock or PWM output at the wrong duty is a common fault. Measure the high time at the 50% level and divide by the period.
Duty cycle gets its own guide, with worked examples and the link to average voltage: how to measure PWM duty cycle with an oscilloscope.
6Measure rise and fall time (10% to 90%)
No real edge is vertical. Rise time is the time the edge takes to climb from 10% to 90% of the amplitude; fall time is the time from 90% back down to 10%. Using 10% and 90% instead of the very bottom and top keeps the slow-settling corners out of the number. For a 0–5 V signal the 10% point is 0.5 V and the 90% point is 4.5 V.
- Trigger on the rising edge and turn the timebase down until the edge spans several divisions.
- Place one voltage cursor at 0.5 V and another at 4.5 V, or note where those levels fall on the grid.
- Read the time between the two crossings, using time cursors if your scope has them.
Worked example: at 10 ns/div, the edge crosses 0.5 V at 2.0 divisions and 4.5 V at 4.5 divisions. That is 2.5 divisions × 10 ns = 25 ns rise time. Repeat on the falling edge for the fall time; the two are often different.
The scope has a rise time too
| Real edge | Scope bandwidth (rise time) | Displayed rise time (approx.) |
|---|---|---|
| 24 ns | 50MHz (≈ 7 ns) | √(24² + 7²) = 25 ns |
| 24 ns | 100MHz (≈ 3.5 ns) | √(24² + 3.5²) ≈ 24.3 ns |
| 5 ns | 50MHz (≈ 7 ns) | √(5² + 7²) ≈ 8.6 ns |
| 5 ns | 100MHz (≈ 3.5 ns) | √(5² + 3.5²) ≈ 6.1 ns |
The probe matters as much as the scope here: a probe on its 1x setting, or one rated below the scope's bandwidth, slows every edge. Keep the ground lead short, too, or it can add ringing that makes the 90% crossing hard to pin down.
Let the scope do the counting
Most digital scopes calculate all of these from the captured samples. The names and exact definitions differ between brands, so check your manual, but these are common:
| Measurement | What it reports on a square wave |
|---|---|
| Vmax / Vmin / Vpp | Highest and lowest samples and their difference, including overshoot |
| Vtop / Vbase / Vamp | The settled high and low levels and their difference, ignoring overshoot (on many scopes) |
| Period / Frequency | Time between like edges and its reciprocal |
| +Width / −Width | High time and low time, usually at the 50% level |
| +Duty | High time ÷ period |
| Rise / Fall time | Edge time between 10% and 90%, often adjustable thresholds |
Auto measurements are only as good as the capture. With only part of a cycle on screen, or an edge just a few samples wide, the scope may report nothing or an unstable value. Check the numbers against the grid at least once, the same way you did above.
How much bandwidth a square wave needs
An ideal square wave is a sine at the fundamental frequency plus odd harmonics: the 3rd at a third of the amplitude, the 5th at a fifth, and so on. A scope that passes only the first few harmonics shows rounded corners. A common rule of thumb is a bandwidth of at least five times the square wave's frequency, but for edges the better comparison is rise time, using the 0.35 ÷ bandwidth approximation explained in what oscilloscope bandwidth means.
Bars use a logarithmic scale: each step is ten times the last.
In practice, a 1 kHz test signal looks square on almost anything, while a microcontroller pin with nanosecond edges needs a bench scope to show its real rise time.
Which scope you need for square waves
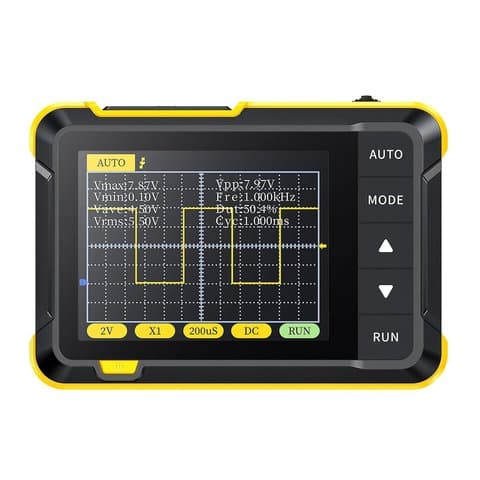
For levels, period and duty cycle on slow signals, a pocket unit such as the FNIRSI DSO152 (200kHz, 1 channel) is enough. For logic and clock edges, look at a bench scope. Compare them all in our best beginner oscilloscopes roundup.
Bench scopes in our reviews
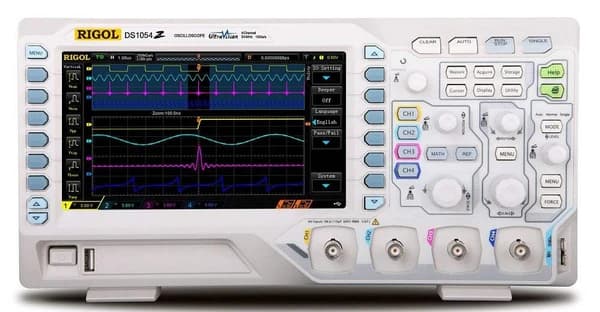
50MHz, 4 channels, 1 GSa/s. Suited to hobbyists, students and general electronics.
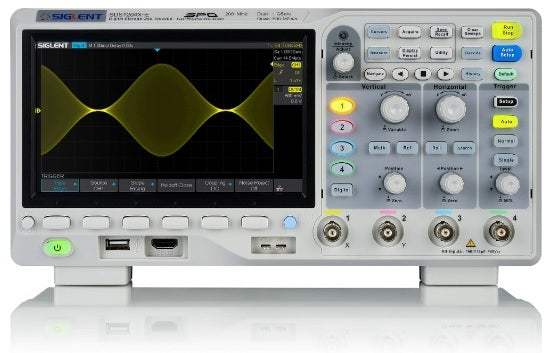
100MHz, 4 channels, 1 GSa/s, for projects that will get more demanding.

100MHz, 2 channels, 1 GSa/s; an oscilloscope and waveform generator in one unit.
As an Amazon Associate I earn from qualifying purchases. Prices and availability are shown on Amazon.
Frequently asked questions
Why does my square wave look rounded on the oscilloscope?
The usual causes are an undercompensated 10x probe, a probe left on 1x (which has much less bandwidth), or a square wave too fast for the scope's bandwidth. Adjust the probe trimmer on the calibration output first. If the corners are still round, the circuit's edges may genuinely be slow, for example because of a heavy capacitive load.
Should I use AC or DC coupling for a square wave?
Use DC coupling. AC coupling passes the signal through a high-pass filter, so a low-frequency square wave shows sloping tops that droop towards the center, and the whole trace moves when the duty cycle changes. DC coupling shows the true high and low levels relative to ground, which is what you want to measure.
What frequency square wave can a 50MHz oscilloscope display?
It will trigger on and count much faster signals, but the shape suffers. A common rule of thumb is to keep the square wave below about one fifth of the bandwidth so the 3rd and 5th harmonics get through, which means roughly 10MHz on a 50MHz scope. For edge measurements, compare rise times instead: a 50MHz scope's own rise time is about 7 ns.
What is the difference between Vpp and Vamp on a square wave?
Vpp is the highest sample minus the lowest, so it includes any overshoot or spikes on the edges. Vamp, offered on many scopes, is the settled top level minus the settled base level, which ignores overshoot. On a clean square wave they are nearly equal; a big gap between them means the edges are overshooting or ringing.
Can a multimeter measure a square wave?
Only partly. On DC volts a meter shows roughly the average, which for a 0–5 V square wave at 50% duty is about 2.5 V. Its AC reading depends on whether it is True-RMS. Some meters also read frequency and duty cycle. None of them show the levels, edges or overshoot, which is what the scope is for.