HOW-TO GUIDE
How to Read an Oscilloscope Screen
By the OhmSavvy Research Team ·
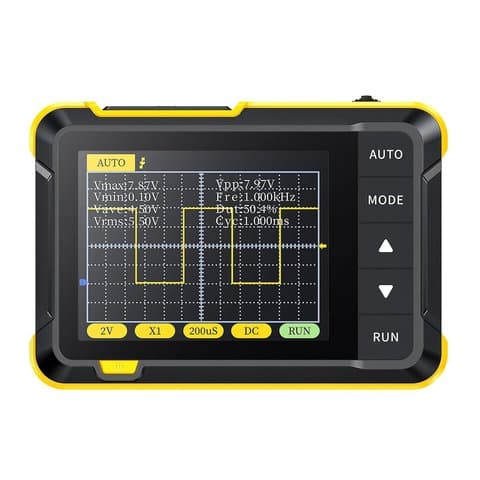
Get a safe signal on screen before you read it
- Practice reading the screen on your scope's built-in test output or a low-voltage circuit such as a battery or USB-powered board.
- A bench scope's probe ground clip is normally tied to mains earth through the power cord. Clipping it to a point that isn't at earth potential, for example on a mains-connected, non-isolated circuit, shorts that point to earth through the ground lead and can cause damage, fire or injury. Never defeat the scope's earth to work around this; use an isolation transformer on the device under test, a differential probe, or an isolated-channel or handheld scope rated for the job.
- Stay within the maximum input voltage and CAT rating marked on the probe and scope. Standard 1x/10x probes are not for mains work unless their rating explicitly says so.
The graticule: a grid of divisions
The grid on the screen is called the graticule. On most scopes it has 10 divisions across and 8 divisions up and down. Each square is one major division. The two solid center lines are usually marked with smaller tick marks that split each division further, often into five, so you can read to a fraction of a division; the exact number of ticks varies by model.
The vertical axis is voltage and the horizontal axis is time, flowing left to right. A division has no fixed value of its own. What it is worth depends entirely on the scale settings shown on screen, which is why the first thing to do before reading any waveform is to check those settings.
What the readouts around the grid mean
Digital scopes print their settings around the edge of the graticule. Layouts differ between brands, but these are the items to look for:
V/div (per channel)
Volts per vertical division, shown next to each channel's number or color.
Time/div
Seconds per horizontal division, the same for every channel.
Ground marker
A small arrow or channel number at the left edge showing where 0 V sits.
Trigger marker
Shows the trigger level (right edge) and the trigger point in time (top).
Coupling
DC or AC. AC coupling removes the DC part of the signal from the display.
Probe ratio
1x or 10x. It must match the probe, or every voltage reads wrong.
Turning divisions into volts and seconds
Every reading on the screen follows the same three steps, whether you are measuring a voltage or a time. Count the divisions, multiply by the matching scale setting, and you have the value. For time, one more step turns a period into a frequency.
01
Count divisions
Up and down, or across, to 0.2 div
02
× scale setting
V/div vertically, time/div across
03
Read the value
Volts, or seconds; f = 1 ÷ period
The two formulas
Voltage = vertical divisions × V/div
Time = horizontal divisions × time/div, and frequency = 1 ÷ period.
Example 1: reading a sine wave
The screen below is set to 2 V/div and 1 ms/div. Read the vertical size first, then the horizontal.
- Peak-to-peak: the top of the wave is 3 divisions above the center line and the bottom is 3 below, so 6 divisions × 2 V = 12 V peak-to-peak.
- Peak (amplitude): half of that, 3 divisions × 2 V = 6 V, measured from the center line, which is 0 V here.
- RMS: for a pure sine wave, Vrms = Vpeak ÷ √2, so 6 ÷ 1.414 ≈ 4.24 V. This only applies to sine waves.
- Period: one complete cycle, peak to next peak, spans 4 divisions × 1 ms = 4 ms.
- Frequency: 1 ÷ 0.004 s = 250 Hz. You can check this by counting cycles: 10 divisions = 10 ms on screen, and 2.5 cycles fit in it.
Example 2: reading a square wave (a logic signal)
Here the scope is set to 2 V/div and 10 µs/div, with the channel's 0 V marker on the center line and DC coupling. The low part of the wave sits on 0 V and the high part sits above it, which is what a typical 5 V logic signal looks like.
- High level: 2.5 divisions above the 0 V line × 2 V = 5 V. The low level sits on the 0 V line, so the signal swings from 0 V to 5 V.
- Period: from one rising edge to the next is 5 divisions × 10 µs = 50 µs, so the frequency is 1 ÷ 0.00005 s = 20 kHz.
- Duty cycle: the signal is high for 2.5 divisions (25 µs) out of 50 µs, which is 50%. On a PWM signal, this is the number that changes.
If you switched this channel to AC coupling, the scope would remove the average (DC) level and the wave would recenter around the 0 V line, swinging roughly from -2.5 V to +2.5 V on screen. The signal itself hasn't changed, only the display. Use DC coupling when the actual levels matter, as they do for logic signals.
Example 3: reading a DC level
A steady DC voltage shows as a flat horizontal line. Its value is simply its height above the 0 V marker. Here the scope is at 1 V/div with 0 V on the center line.
For a plain DC reading like this, a multimeter is usually quicker and more precise. A scope earns its place when that line isn't perfectly flat, for example when you want to see ripple or dips on a supply. Our oscilloscope vs multimeter guide covers which to reach for.
Quick conversion table
The same counted divisions mean very different things at different settings. A few examples:
| You count | Setting | Result |
|---|---|---|
| 4 div vertical | 0.5 V/div | 2 V |
| 4 div vertical | 5 V/div | 20 V |
| 3.2 div vertical | 1 V/div | 3.2 V |
| 5 div per cycle | 1 ms/div | 5 ms period = 200 Hz |
| 2 div per cycle | 50 µs/div | 100 µs period = 10 kHz |
| 4 div per cycle | 0.25 µs/div | 1 µs period = 1 MHz |
To see how much the V/div setting matters, take the 6-division count from Example 1. At 2 V/div it meant 12 V peak-to-peak, but the same 6 divisions counted at other settings give completely different voltages. The count alone tells you nothing until you multiply it by the scale.
Tips for reading more accurately
- Fill the screen. A waveform that spans 6 divisions can be read far more precisely than one squeezed into 1. Lower the V/div until it nearly fills the height, without clipping off the top or bottom.
- Measure between matching points. Count a period from one rising edge to the next, or from peak to peak, at the same height on the wave.
- Line features up with a grid line. Use the position knobs to put a peak or edge exactly on a division line, then count along the center axis where the fine ticks are.
- Check the probe ratio. A 10x probe with the channel set to 1x makes every voltage read ten times too small.
- Cross-check with the scope. Automatic measurements and cursors read the same data more precisely than your eye. Use your grid count to confirm they make sense.
The graticule and the two scale settings work the same way on every digital scope, so these habits carry over whichever model you use. These are two of the bench scopes we cover:
Scopes in our reviews
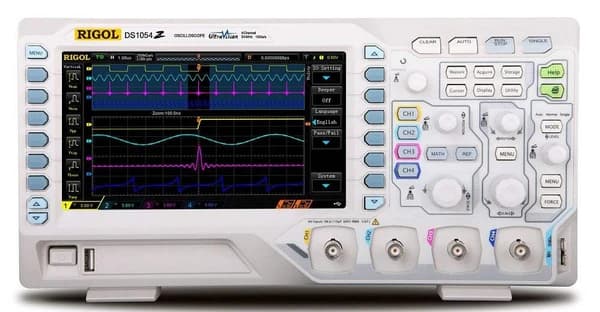
50MHz, 4 channels, 1 GSa/s, with a 7-inch display and strong community documentation.
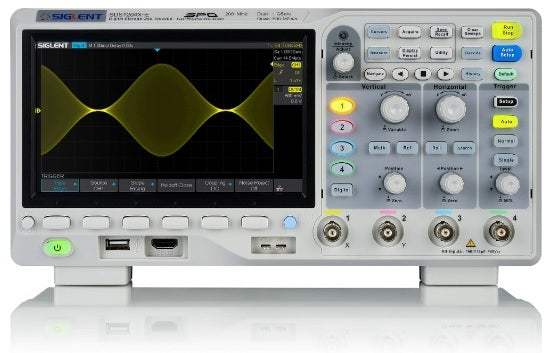
As an Amazon Associate I earn from qualifying purchases. Prices and availability are shown on Amazon.
If you haven't got a stable waveform to read yet, start with how to use an oscilloscope and how to trigger an oscilloscope. If square waves show rounded or spiky corners, your probe needs compensating. And if a fast signal looks smaller or more rounded than expected, the scope's bandwidth or sample rate may be the limit. New to scopes entirely? Read what is an oscilloscope or browse our beginner oscilloscope picks.
Frequently asked questions
How many divisions are on an oscilloscope screen?
Most digital oscilloscopes use a grid of 10 divisions across and 8 divisions up and down. The center lines carry finer tick marks, often five per division, so you can estimate to a fraction of a division. A few models use a different grid, so check how many divisions yours shows before converting a count into volts or seconds.
What does V/div mean on an oscilloscope?
V/div means volts per division: how much voltage one vertical square on the grid represents for that channel. At 2 V/div, a trace that is 3 divisions tall spans 6 V. Each channel has its own V/div setting, and it only reads correctly if the channel's probe setting (1x or 10x) matches the probe you are using.
How do you work out frequency from an oscilloscope screen?
Count how many horizontal divisions one full cycle takes, multiply by the time/div setting to get the period, then divide 1 by the period. For example, 5 divisions per cycle at 1 ms/div is a 5 ms period, and 1 / 0.005 s = 200 Hz. Measure between matching points, such as one rising edge to the next.
Why does my oscilloscope read voltages 10 times too low?
Almost always the probe is switched to 10x while the channel is set to 1x. A 10x probe divides the signal by ten before it reaches the scope, so the channel has to multiply it back. Set the channel's probe ratio to match the switch on the probe and the readings and on-screen V/div will be correct again.
When should I use AC coupling instead of DC coupling?
Use DC coupling for most readings, because it shows the true levels, including where the signal sits relative to 0 V. Switch to AC coupling when you want to see a small variation, such as ripple, riding on a large DC voltage. It removes the DC part so you can turn the V/div down without the trace leaving the screen.
