HOW-TO GUIDE
How to Measure Phase Difference Between Two Signals
By the OhmSavvy Research Team ·
What phase difference actually means
Two signals of the same frequency that reach corresponding points (like a rising zero-crossing) at different times are "out of phase" by an amount expressed as an angle — 360° represents one full period of delay, 180° represents half a period (effectively inverted), and 0° means perfectly aligned.
Setting up both channels
Connect one probe to the reference signal on CH1 and the other to the signal you're comparing on CH2. Set the trigger source to CH1 so both traces hold still relative to each other, and adjust each channel's vertical scale so both waveforms are clearly visible without needing to compare wildly different trace heights.
1Method 1: Timing the delay manually
Use the scope's cursors to measure the horizontal time (Δt) between a zero-crossing on CH1 and the corresponding zero-crossing on CH2, then measure the period (T) of one full cycle on either channel. Phase difference in degrees = (Δt ÷ T) × 360°. For example, a 1ms delay on a signal with a 4ms period gives (1 ÷ 4) × 360° = 90°.
2Method 2: Automatic phase measurement
Many digital scopes include a built-in phase measurement in their Measure menu, calculating the same delay-to-angle relationship automatically once both channels are displayed. This is faster and avoids manual cursor placement error, though it's worth spot-checking an automatic reading against a quick manual measurement if the result looks unexpected.
3Method 3: Lissajous figure (XY mode)
Switch the scope to XY mode, which plots CH1 on the horizontal axis against CH2 on the vertical axis instead of both against time. For two same-frequency sine waves, the resulting shape directly reveals the phase relationship:
This method gives a quick visual read on phase relationship without needing to calculate anything, though pulling an exact angle out of a tilted ellipse's shape takes a bit more work than reading a direct cursor-based time delay.
Thinking of phase as a rotation
Time-domain traces and Lissajous figures both show phase indirectly. It can help to picture one full cycle as one full turn of a clock hand: 0° is 12 o'clock, 90° is 3 o'clock, 180° is 6 o'clock, and 270° is 9 o'clock. A "90° phase difference" is just one signal's hand sitting a quarter-turn ahead of the other's, repeating every cycle.
A real-world reference point: the RC filter
Delay-to-degrees lookup at 1 kHz
At 1 kHz the period is 1 ms, so every 100 µs of delay equals 36°. The table applies the same (Δt ÷ T) × 360° formula to a few round values, which makes a handy check on what your cursors or automatic readout should show. For other frequencies, scale the delay: at 10 kHz the same angles correspond to one tenth of these times.
| Measured Δt at 1 kHz | Δt ÷ T | Phase difference |
|---|---|---|
| 125 µs | 0.125 | 45° |
| 250 µs | 0.25 | 90° |
| 333 µs | 0.333 | 120° (as between three-phase lines) |
| 500 µs | 0.5 | 180° (inverted) |
| 750 µs | 0.75 | 270° (same as 90° leading) |
Resolution is rarely the limit on a modern scope. Even at a modest 100 MSa/s, samples are 10 ns apart, which at 1 kHz is 10 ns ÷ 1 ms × 360° ≈ 0.004°. In practice, noise on a slow zero-crossing and probe mismatch limit accuracy far more, so spread one or two cycles across the screen and use averaging if the readout jitters.
RC filter phase across frequency
To build a test circuit, a 1.6 kΩ resistor and a 100 nF capacitor give a cutoff of 1 ÷ (2π × 1,600 × 0.0000001) ≈ 995 Hz, close enough to 1 kHz. For a first-order low-pass filter the output lags by arctan(f ÷ fc), so sweeping your generator around the cutoff should produce the calculated lags below. Real component tolerances of a few percent will shift the readings slightly, which is itself a useful sense of how precise the measurement needs to be.
Calculated values for an ideal first-order RC low-pass filter, not measurements. The lag approaches but never reaches 90° as frequency rises.
Common mistakes
- Measuring Δt between non-corresponding points on the two waveforms (a rising edge on one, a falling edge on the other).
- Comparing signals that are actually at slightly different frequencies, giving a constantly drifting result.
- Forgetting to check which channel is set as the trigger source, leaving one trace unstable.
Scopes with two channels for this measurement
Phase comparison needs at least two input channels, and ideally XY mode for the Lissajous method above. Four channels let you compare an input against several outputs at once, such as each stage of a multi-stage filter, without moving probes. Match the two probes' attenuation settings, and compensate both on the scope's calibration output first, because a badly compensated probe adds its own phase shift at higher frequencies.
Two-channel-and-up scopes
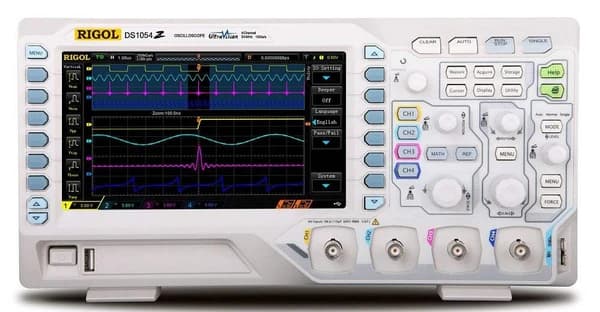
4 channels, 50MHz, with XY mode for Lissajous figures.
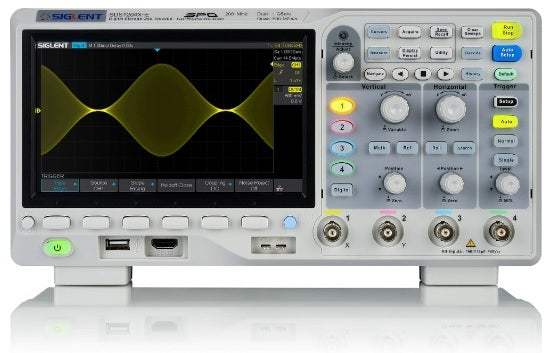
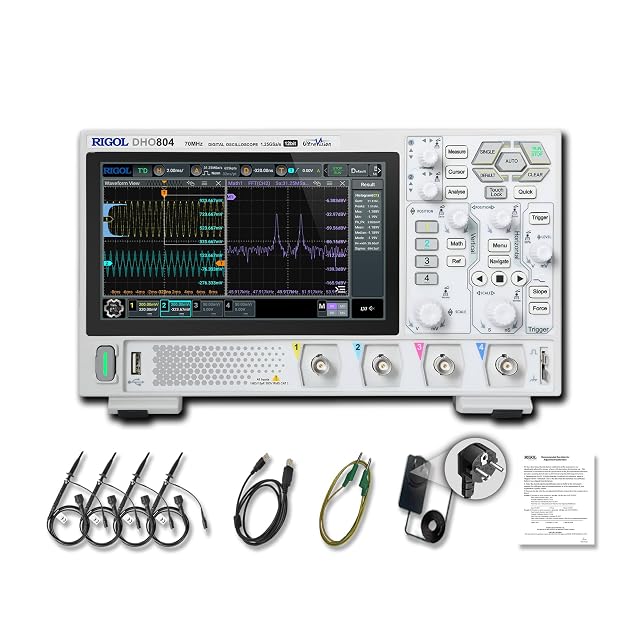
Hands-on tested. 4 channels, 70MHz and 12-bit vertical resolution for clean zero-crossings on small signals.
As an Amazon Associate I earn from qualifying purchases. Prices and availability are shown on Amazon.
Frequently asked questions
Does phase difference measurement only work on sine waves?
It's clearest and most commonly done on sine waves, but the same time-delay-to-angle principle applies to any two same-frequency repeating signals, measured between corresponding matching points (such as corresponding rising edges) rather than zero-crossings specifically.
What if my two signals aren't exactly the same frequency?
Phase difference is only a stable, meaningful number between signals of the same frequency. If the frequencies differ even slightly, the apparent phase relationship drifts continuously over time rather than settling on one value — check both channels' measured frequency matches before trusting a phase reading.
Which channel should I trigger on for this measurement?
Trigger on whichever channel you're treating as the reference (often the input to a circuit, with the other channel being its output). This keeps both traces stable and stationary relative to each other on screen, which is necessary to measure the delay between them accurately.
Why does my Lissajous figure look like a tilted ellipse instead of a circle or a line?
A tilted, non-circular ellipse indicates a phase difference somewhere between 0° and 90° (or between 90° and 180°), rather than one of those two clean extremes. The exact angle can be calculated from the ellipse's shape, though for most practical troubleshooting, recognizing "somewhere in between" is often enough without computing the precise figure.
How do I tell whether a signal is leading or lagging?
Look at which trace reaches the matching point first, measured from the trigger channel. If CH2 crosses zero going upward after CH1 does, CH2 lags CH1; if it crosses before, it leads. Automatic phase readouts usually show this as a sign, but conventions differ between brands, so confirm the sign once against the traces before relying on it in a report.