HOW-TO GUIDE
How to Measure PWM Duty Cycle With an Oscilloscope
By the OhmSavvy Research Team ·

Safety first: know where the ground clip goes
- On a mains-powered bench scope, the probe ground clip is connected to mains earth. Clip it only to the circuit's ground, such as a microcontroller board's GND pin. Clipping it to a point at another voltage shorts that point to earth.
- PWM that drives motors, heaters or lamps can switch high currents, and a high-side switch node is not referenced to ground. Probe the low-voltage control signal where you can, or use a differential probe. Never float the scope by removing its earth connection.
- If the PWM controller is on the mains side of a power supply, use an isolation transformer on the device under test or a rated differential probe.
What duty cycle means
Pulse-width modulation (PWM) switches a signal between two levels at a fixed frequency and varies how long it stays high in each cycle. Duty cycle is that high time as a fraction of the whole period.
The formula
1Connect the probe and scale the signal
Clip the probe ground to the circuit ground and touch the tip to the PWM output. Set the probe switch and the channel's probe ratio to match (10x is normal). Then:
- Use DC coupling. AC coupling removes the DC level, so the trace floats around the center line and the true 0 V and high levels are lost. On a PWM signal whose average changes with duty, the trace even shifts as the duty changes.
- Set V/div so the full swing fills several divisions: 2 V/div puts a 0-5 V signal at 2.5 divisions, 1 V/div suits 3.3 V logic.
- Set the timebase for two or three full cycles on screen. Too slow and each pulse is a thin sliver you can't time accurately.
If the screen controls are new to you, the first-session guide to using an oscilloscope covers them, and how to read an oscilloscope screen explains the grid.
2Trigger on the rising edge
Set an edge trigger on the PWM channel, slope rising, with the level at about half the high voltage: 2.5 V for 5 V logic, around 1.65 V for 3.3 V. Each capture now starts on a rising edge, so every pulse lines up in the same place and the trace stands still. With the trigger point at the center of the screen, a rising edge sits on the center line and the high time extends to its right.
If the trace still drifts, the trigger level is probably outside the signal or the mode is wrong; the trigger guide has a fix list. If the duty cycle is changing as you watch, as it does on a fading LED or a speed-controlled motor, press Single or Stop to freeze one capture.
3Measure high time and period with divisions
Measure both times at the 50% level, halfway up each edge, so slow edges don't bias the result. Count the horizontal divisions for the high part of one pulse, then for one full period from rising edge to rising edge, and multiply each by the time/div setting.
Worked example from the screen above: high time = 1 div × 200 µs/div = 200 µs. Period = 5 div × 200 µs/div = 1 ms. Duty cycle = 200 µs ÷ 1 ms = 20%, and frequency = 1 ÷ 1 ms = 1kHz. You don't even need the time/div setting for the duty cycle alone: it is simply 1 division out of 5. You do need it for frequency, which is covered in more depth in how to measure frequency with an oscilloscope.
4Use cursors and automatic measurements
Division counting is limited to about a fifth of a division. For better resolution, place the two vertical time cursors on the 50% points of the rising and falling edges to read the high time as Δt, then move the second cursor to the next rising edge to read the period. Most digital scopes also measure duty cycle directly. Names vary between brands, so check your manual, but these are common:
| Measurement | What it reports |
|---|---|
| +Duty (positive duty) | High time ÷ period, as a percentage |
| -Duty (negative duty) | Low time ÷ period; +Duty and -Duty add to 100% |
| +Width (positive pulse width) | Time the signal stays above the middle level |
| Period / Freq | Time between matching edges, and 1 ÷ that time |
| Rise / Fall time | Edge speed, usually 10% to 90%; useful when pulses are short |
Automatic measurements work best with at least one full cycle on screen, and preferably several. If the result jumps around, add cycles to the screen or enable measurement statistics where your scope offers them.
Worked examples
The same method at different timebases and logic levels. The average voltage column assumes an ideal PWM signal, explained in the next section.
| Time/div | Period | High time | Frequency | Duty | Average (ideal) |
|---|---|---|---|---|---|
| 200 µs/div | 5 div = 1 ms | 1 div = 200 µs | 1kHz | 20% | 0.20 × 5 V = 1 V |
| 50 µs/div | 4 div = 200 µs | 3 div = 150 µs | 5kHz | 75% | 0.75 × 3.3 V ≈ 2.48 V |
| 10 µs/div | 5 div = 50 µs | 2 div = 20 µs | 20kHz | 40% | 0.40 × 12 V = 4.8 V |
| 0.5 ms/div | 4 div = 2 ms | 0.5 div = 250 µs | 500Hz | 12.5% | 0.125 × 5 V = 0.625 V |
Duty cycle and average voltage
For an ideal PWM signal that switches between 0 V and a high level, the average voltage is duty cycle × high level. The 20% signal above averages 0.2 × 5 V = 1 V. This is why PWM can dim an LED or slow a motor: the load responds to the average. Real signals are close but not exact, because the low level may sit slightly above 0 V, the high level may sag under load and the edges take time.
Many meters read close to this average on a fast PWM signal, though some are confused by the edges, so treat the meter reading as a cross-check. The scope's own mean or average measurement, taken over whole cycles, does the same job. Across the duty range, a 0-5 V signal averages:
A microcontroller PWM example
Many microcontroller boards set PWM with an 8-bit value, where 0 means always off and 255 means always on, and the duty cycle is the value ÷ 255. Check your platform's documentation, because resolution and the default PWM frequency vary between boards and pins. On a 5 V board:
- A value of 64 gives 64 ÷ 255 ≈ 25.1% duty, which averages about 0.251 × 5 V ≈ 1.25 V. On the scope, the pulse is high for about a quarter of each period.
- A value of 191 gives 191 ÷ 255 ≈ 74.9%, about 3.75 V average.
- Values of 0 and 255 produce a flat line at 0 V or 5 V with no edges, so automatic duty and frequency measurements have nothing to measure.
If the measured duty doesn't match what the code asks for, look for an inverted output, a timer shared with another function, or a pin that doesn't support hardware PWM. A second channel on the scope helps here: trigger on one PWM output and compare it with another.
Which scope you need for PWM measurements
PWM frequencies on hobby boards are usually low by scope standards, so almost any scope can measure duty cycle. The pocket FNIRSI DSO152 (200kHz bandwidth, 1 channel) is enough for basic checks on low-frequency PWM. Bench scopes such as the Rigol DS1054Z (50MHz, 4 channels) and Hantek DSO2D10 (100MHz, 2 channels) add the channels to compare several PWM outputs, or PWM against the signal it drives, and the bandwidth to see edges on faster switching. For power converters that use PWM, see oscilloscope bandwidth for switching power supplies. Compare all the picks in best beginner oscilloscopes.
Scopes for PWM work in our reviews
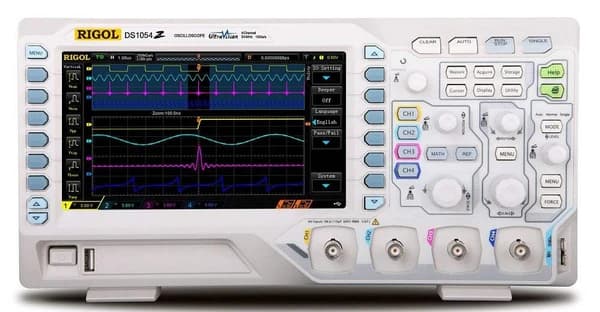
50MHz, 4 channels, 1 GSa/s. Four channels at this price is rare.
100MHz, 2 channels, 1 GSa/s, plus a built-in waveform generator in a compact footprint.
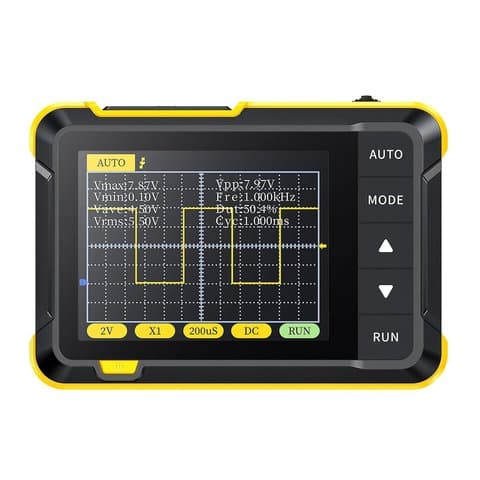
200kHz, 1 channel, 2.5 MSa/s, pocket-sized: for basic diagnostics, not a bench replacement.
As an Amazon Associate I earn from qualifying purchases. Prices and availability are shown on Amazon.
Frequently asked questions
Can a multimeter measure PWM duty cycle?
Some can. Many digital multimeters have a duty cycle or percent function on the frequency range, which works on clean, ground-referenced signals within the meter's frequency limit. Check your meter's manual. A meter only gives a number, though; a scope also shows the pulse shape, slow edges, ringing and glitches that can make that number misleading.
What is the difference between positive and negative duty cycle?
Positive duty cycle is the high time divided by the period, and negative duty cycle is the low time divided by the period, so the two always add up to 100%. Which one matters depends on the circuit: if a driver turns the load on when its input is low, the negative duty cycle is the on-time.
Does PWM frequency affect the duty cycle reading?
Not in principle, because duty cycle is a ratio. In practice it matters when the pulses get short compared with the edges. If the rise and fall times are a noticeable fraction of the high time, where you measure on the edge changes the answer, so measure at the 50% level and use enough bandwidth and sample rate.
Why does my scope show no duty cycle reading at 0% or 100%?
At 0% the output stays low and at 100% it stays high, so there are no edges. With no edges, the scope cannot find a period or a pulse width, and most scopes show the measurement as invalid or blank. The flat line itself is the answer: confirm its level against the ground marker.
How do I measure an RC servo signal with an oscilloscope?
Measure the positive pulse width rather than the duty cycle. Hobby servos typically expect a pulse of roughly 1 to 2 ms repeated about every 20 ms, so the duty cycle sits around 5 to 10% and barely moves. Check your servo's documentation for its exact range, trigger on the rising edge, and watch the +Width measurement while you move the control.