HOW-TO GUIDE
Why Does an Oscilloscope Show the Wrong Voltage?
By the OhmSavvy Research Team ·
Safety: a wrong reading can hide a dangerous voltage
- A channel set to 10x with a probe on 1x reads ten times too high, which is merely confusing. The reverse mismatch is the risky one: 120 V shows as 12 V, and you may treat a lethal node as safe. Confirm the ratio before you trust any reading on a powered circuit.
- On a typical bench scope the probe ground clip is bonded to mains earth. Clipping it to a non-earthed point, such as anywhere on the primary side of an off-line power supply, creates a short through the probe. Use a rated differential probe or an isolated, suitably rated instrument, never a "cheater" plug that lifts the earth.
- Check the voltage ratings printed on the probe and on the scope's input (and the much lower limit of any 50 Ω input). For anything on household wiring you are unsure of, stop and call a licensed electrician.
Why does an oscilloscope show the wrong voltage? Start with the size of the error
Before changing settings at random, compare the reading with what you expected and work out the ratio. Most measurement mistakes on a scope produce a characteristic, repeatable error: a clean factor of ten, a clean factor of two, the 2.83 that separates peak-to-peak from RMS on a sine, or a loss that grows with frequency. An error that is a few percent and steady is a different animal again, usually resolution or gain accuracy rather than a setting. The table below lists the common fingerprints for a signal you expected to read 1.00 V.
| You read (expected 1.00 V) | Ratio | Most likely cause |
|---|---|---|
| 0.10 V | ÷ 10 | 10x probe, channel set to 1x |
| 10.0 V | × 10 | 1x probe, channel set to 10x |
| 2.00 V | × 2 | 50 Ω generator set for a 50 Ω load, measured on a 1 MΩ input |
| 2.83 V | × 2.83 | Reading Vpp of a 1 V RMS sine |
| 0.35 V | ÷ 2.83 | Reading Vrms of a 1 Vpp sine |
| 0.71 V | × 0.707 | Sine at the scope's rated bandwidth, or at an active BW limit |
| About 0 V (Mean) | — | AC coupling on a DC level |
| Stuck at the screen limit | — | Waveform clipped off the top or bottom |
| 0.97 V or 1.03 V, steady | ± a few % | Normal gain accuracy, or a signal using too little of the screen |
If the scope and a multimeter simply disagree, that is a related but separate problem with its own ratios, explained in why scope and multimeter readings differ. This page is about the scope's own number being wrong for the signal in front of it.
Causes, checks and fixes
| Symptom | Likely cause | How to check | Fix |
|---|---|---|---|
| Exactly ten times low or high | Probe ratio and channel setting disagree | Compare the switch on the probe body with the channel's probe menu | Set both to the same factor |
| Twice the generator setting | Generator assumes a 50 Ω load | Look for a Load or Output Impedance setting on the generator | Set the generator to High-Z, or terminate in 50 Ω |
| Far too small on a circuit node | Scope input set to 50 Ω | Check the channel's impedance setting | Use 1 MΩ for passive probes |
| DC rail reads 0 V mean | AC coupling | Check coupling in the channel menu | Switch to DC coupling |
| Pulse train sits partly below zero | AC coupling shifting the baseline | Compare Vmax and Vmin with DC coupling | Use DC coupling for levels |
| Reading drops as frequency rises | Bandwidth limit, probe on 1x, or scope bandwidth | Look for a BW indicator; check the probe switch | Limit off, probe on 10x, or a faster scope |
| Square-wave height wrong; corners rounded or spiked | Probe not compensated | Probe the calibration output | Adjust the probe's trimmer |
| Small signal reads high and wobbles | Hum from a ground loop or long ground lead | Short the tip to its own ground clip and read | Shorter ground, common outlet, averaging |
| Voltage across a part is nonsense | Single-ended probe used across a floating component | Is either end at ground? | Two probes and CH1 − CH2 math, or a differential probe |
| Vpp stuck while the signal grows | Waveform clipped off screen | Look for a trace beyond the graticule | Increase volts/div until it all fits |
| Readings off by a few percent | Signal fills only a division or two | Count divisions occupied | Reduce volts/div so it fills most of the screen |
1Match the probe ratio to the channel
A 10x passive probe contains a 9 MΩ resistor that forms a divider with the scope's 1 MΩ input, so only a tenth of the signal reaches the BNC. The scope has no way of knowing that unless you tell it, which is what the probe or attenuation item in each channel menu is for. When the menu says 10x, the scope multiplies everything it displays and measures by ten. Leave it at 1x and a 5 V logic signal comes out as 0.5 V; a 3.3 V rail shows 0.33 V. Get it wrong the other way, with the probe switch on 1x and the channel on 10x, and the same 3.3 V rail reads 33 V.
The trace shape looks exactly the same in both cases, which is why this one is so easy to miss: only the volts/div label and the measurements change. Some probes have a sense pin that sets the ratio automatically on compatible scopes, but ordinary switchable probes do not, so check each channel by hand, especially after you swap probes between channels or someone else has used the scope. Also note 100x and high-voltage probes, which need a 100x setting. Fitting the probe properly is covered in how to connect an oscilloscope probe correctly.
2Pick the measurement that answers your question
A scope's measurement menu offers a dozen voltage readouts, and each is correct for its own definition. Many "wrong" readings are a right answer to a different question. A sine wave with a 2 V peak has a peak-to-peak value of 4 V, an RMS value of about 1.41 V (2 ÷ √2) and a mean of 0 V. A 0 to 5 V square wave at 50% duty has a Vpp of 5 V, a mean of 2.5 V and an RMS of about 3.54 V (5 × √0.5) including its DC part. Drop the duty to 25% and the mean falls to 1.25 V while the RMS is 2.5 V (5 × √0.25), even though Vpp is still 5 V.
| Signal | Vpp | Mean | RMS (AC + DC) |
|---|---|---|---|
| Sine, 2 V peak, no DC | 4.00 V | 0 V | 1.41 V |
| Square, 0 to 5 V, 50% duty | 5.00 V | 2.50 V | 3.54 V |
| PWM, 0 to 5 V, 25% duty | 5.00 V | 1.25 V | 2.50 V |
| 5 V rail with 50 mV p-p ripple | 0.05 V | 5.00 V | 5.00 V |
Two further traps sit inside the same menu. Vpp includes every spike and noise excursion, so a square wave with a little overshoot reads higher than its settled height; Vamp (top minus base) ignores those and reports the plateau-to-plateau value. And RMS can be computed over the whole screen or over one cycle. With two and a half cycles on screen, a full-screen RMS includes the extra half cycle and drifts as the trigger point moves, so choose the cycle variant or fit a whole number of cycles. The arithmetic for each quantity is laid out in how to measure voltage with an oscilloscope.
3Check DC vs AC coupling
AC coupling inserts a series capacitor that removes the average level of the signal. That makes a 5 V rail's Mean read about 0 V, which is the obvious case. The subtler one is a pulse train: the capacitor shifts the trace so that the area above zero equals the area below. A 0 to 5 V pulse at 10% duty has an average of 0.5 V, so AC-coupled it sits between −0.5 V and +4.5 V. Vpp stays at 5 V, but Vmax reads 4.5 V and Vmin reads −0.5 V, and the baseline moves every time the duty cycle changes.
Very slow square waves add a third symptom: near the coupling capacitor's cutoff, typically a few hertz, the flat tops tilt toward zero, so the measured height depends on where along the top you read it. Use DC coupling whenever the absolute level matters and keep AC coupling for magnifying small ripple. Why the trace jumps up and down when you switch between them is covered in why an oscilloscope waveform shifts vertically.
4Check 50 Ω vs 1 MΩ, at both ends
Termination errors come in two directions. The common one involves a function generator. Most have a 50 Ω output resistance, and when you type 1 Vpp they assume a 50 Ω load, so they actually generate 2 Vpp internally and expect half of it to be lost across the output resistance. A 1 MΩ scope input draws almost nothing, so you see 2 × 1,000,000 ÷ 1,000,050, which is 2.00 Vpp: exactly double the setting. The fix is either to set the generator's load to High-Z, so its display matches what the scope sees, or to terminate the cable with 50 Ω, using a feed-through terminator if your scope has no 50 Ω input.
The opposite mistake is leaving a scope input on 50 Ω while probing a circuit. A node with 1 kΩ of source resistance driving 50 Ω delivers only 50 ÷ 1,050, under 5%, so a 3 V signal reads about 0.14 V, and the circuit is heavily loaded too. 50 Ω inputs also have low voltage limits, often a few volts RMS, so check the manual before connecting anything. For passive probes, always use 1 MΩ. How any probe loads the circuit it touches is explained in why connecting a probe changes the signal.
5Check bandwidth, the BW limit and the probe's 1x setting
A scope's rated bandwidth is the frequency at which a sine wave is displayed at 70.7% of its true amplitude, which is the −3 dB point. The loss starts well below that. Using a simple single-pole model, a sine at half the bandwidth reads about 89% (1 ÷ √(1 + 0.5²)), and at three-quarters it reads 80%. On a 50 MHz scope that means a 25 MHz sine reads roughly 11% low even with every setting correct. Real front ends are shaped differently, often flatter and then steeper, but all of them are at 70.7% at the rated bandwidth.
Calculated with the single-pole model, displayed amplitude = 1 ÷ √(1 + (f ÷ BW)²). Illustrative of the trend, not any specific scope.
Three settings lower the ceiling without announcing it. The bandwidth limit, commonly 20 MHz, turns a 20 MHz signal into a 71% reading. A switchable probe set to 1x typically has far less bandwidth than at 10x, often only a few MHz to a few tens of MHz depending on the probe, so check its label. And square waves and spikes contain harmonics far above their repetition rate, so a fast switching spike can read much lower than it really is. The rise-time rule of thumb, rise time ≈ 0.35 ÷ bandwidth, puts a 50 MHz scope's own rise time at about 7 ns. More on this in what oscilloscope bandwidth means and why a waveform looks distorted.
6Check probe compensation
A 10x probe has an adjustable capacitor that balances the scope's input capacitance. If it is off, low frequencies and high frequencies are divided by slightly different ratios. An under-compensated probe rounds the leading corner of a square wave, so a Vmax or Vamp reading taken at a fast repetition rate comes out low. An over-compensated one adds a spike after each edge: as an illustration, 15% overshoot on a 5 V square wave pushes Vmax to about 5.75 V and, with a matching undershoot on the falling edge, Vpp to about 6.5 V, while Vamp stays near 5 V. Any probe moved to a different scope or channel should be checked on the calibration output; the procedure is in how to compensate an oscilloscope probe.
7Check the ground reference and ground loops
A single-ended probe always measures from its tip to its ground clip, and on an earthed bench scope that clip is earth. To read the voltage across a component where neither end is at ground, say a resistor with 7 V at one end and 5 V at the other, don't move the clip to the 5 V end: that ties the 5 V node to earth and changes the circuit, or worse. Put CH1 on the 7 V end and CH2 on the 5 V end, both grounded normally, and use the math function to display CH1 − CH2 = 2 V, as shown in using math to subtract two signals.
On small signals, the ground connection itself adds error. Hum from a ground loop between two earthed instruments, and pickup on a long ground lead, add to every Vpp and RMS reading, which matters when you are measuring millivolts. A quick check is to clip the probe tip to its own ground lead at the circuit: whatever the scope shows then is error, not signal. A long ground lead also adds ringing on fast edges, inflating Vpp. Ways to reduce both are in why an oscilloscope waveform looks noisy.
8Keep the whole waveform on screen, and read from the ground marker
Automatic measurements are computed from the samples the analog-to-digital converter recorded, and the converter's range is tied to the screen. With 8 vertical divisions at 500 mV/div, the window is 4 V tall (8 × 0.5). A 6 Vpp sine centered on it is clipped at both ends, and Vpp reports roughly 4 V, or slightly more on scopes whose converter range extends a little beyond the graticule. Turning the signal up makes no difference to the reading, which is the giveaway. Many scopes flag such a result, but not all do. Set volts/div so the peaks sit inside the screen with some margin; the full routine is in how to find signal clipping on an oscilloscope.
Vertical offset causes a different, human error. Automatic measurements are referenced to the channel's ground marker, so they are unaffected. But if you count divisions from the center line, the offset is silently included. With 1.5 V of offset at 1 V/div, a trace 2 divisions above center is really at 0.5 V (2 − 1.5), not 2 V. Count from the ground marker, or use cursors, which do the subtraction for you.
9Use the full screen height
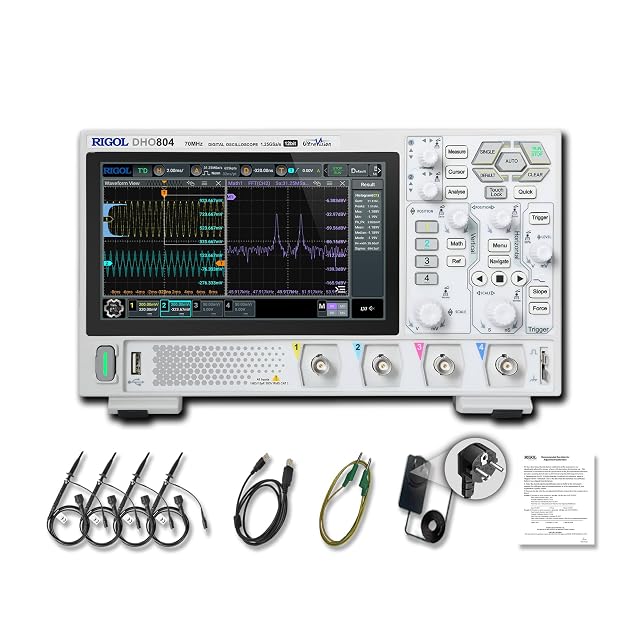
An 8-bit scope splits the full screen into 256 levels. At 2 V/div the screen spans 16 V, so each level is about 62.5 mV (16 ÷ 256), and a 200 mV signal is drawn with barely three steps. At 50 mV/div the same converter resolves about 1.6 mV (0.4 ÷ 256). A 12-bit scope such as the Rigol DHO804 splits the screen into 4,096 levels, sixteen times finer, which helps with small signals on a large offset, but it still pays to fill the screen.
Gain accuracy follows the same logic. Entry-level scopes commonly specify DC gain accuracy as a few percent of full scale; check your model's datasheet for the exact figure. If that figure is ±3% of full scale, then at 1 V/div (8 V full scale) it allows ±0.24 V. On a 6 V signal that is ±4%; on a 1 V signal squeezed into one division it is up to ±24%. A signal filling six of the eight divisions is the practical target. For a reference-grade DC reading, a good bench or handheld multimeter will beat a general-purpose scope.
The fast diagnosis
Scopes for accurate readings
Every scope can be set up wrong, so none of these will fix the errors above on its own. What helps is bandwidth headroom over the signals you measure, and on the DHO804 the finer 12-bit resolution. All three are scopes the owner has bought and used hands-on.
Bench scopes with headroom for accurate voltage readings
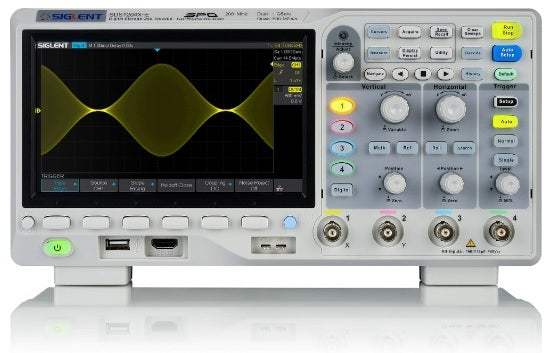
Hands-on tested. 100MHz, 4 channels, 1 GSa/s: twice the bandwidth headroom of a 50MHz scope.
Hands-on tested. 70 MHz, 4 channels and 12-bit vertical resolution for small signals.
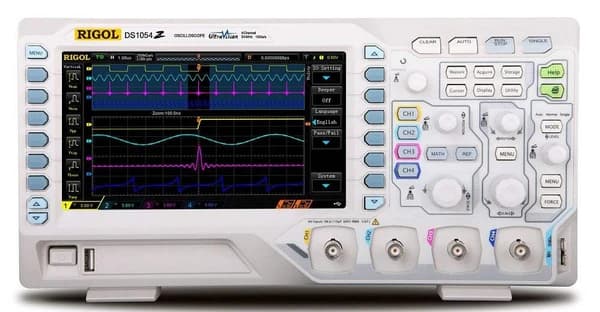
Hands-on tested. 50MHz, 4 channels, 1 GSa/s and a 7-inch display.
As an Amazon Associate I earn from qualifying purchases. Prices and availability are shown on Amazon.
Frequently asked questions
Why is my oscilloscope reading 10 times lower than it should be?
The probe is almost certainly switched to 10x while the channel's probe menu is set to 1x. The probe divides the signal by ten and the scope doesn't multiply it back, so a 3.3 V logic level reads 0.33 V. Set the channel's probe ratio to 10x. If the reading is ten times too high instead, the probe is on 1x and the channel on 10x.
Why does my function generator show double the voltage on my oscilloscope?
Most generators have a 50 Ω output and assume a 50 Ω load when you type an amplitude. Into a 1 MΩ scope input almost no current flows, so you see the full internal voltage, which is twice the setting: 1 Vpp set shows about 2 Vpp. Set the generator's load to High-Z, or add a 50 Ω feed-through terminator at the scope.
Why does my oscilloscope show a lower voltage at higher frequencies?
Every scope's front end rolls off as frequency rises, and at its rated bandwidth a sine wave reads about 70.7% of its true amplitude, by definition. A 20 MHz bandwidth limit, a probe switched to 1x, or a probe rated below the scope all lower that ceiling further. For accurate amplitude, keep the signal well below the bandwidth, ideally a third to a fifth of it.
Should I use Vpp, Vamp or Vrms on an oscilloscope?
Use Vpp for the total swing including spikes and noise, Vamp (top minus base) for the settled height of a square or pulse wave without overshoot, and Vrms when you need the heating value to compare with a True RMS meter. Mean or Vavg gives the DC level. They are all correct; they are just answers to different questions.
Why does the Vpp measurement stop increasing when I raise the signal?
The waveform has grown past the top or bottom of the screen, and the scope's converter can't record anything beyond its range, so the measurement reports the screen limit instead of the real peak. Many scopes mark such a reading with a symbol or warning. Increase volts/div until the whole waveform, peaks included, fits inside the graticule, then read it again.
Does vertical offset change the voltage an oscilloscope measures?
Not the automatic measurements, which are referenced to the channel's ground marker. It only misleads you if you count divisions from the center line by eye, because the center no longer sits at 0 V. Offset can also push part of the waveform off screen, which does corrupt the measurement. Read voltages from the ground marker or use cursors.
Can a ground loop make my oscilloscope read the wrong voltage?
Yes, on small signals. When the scope and the circuit are both earthed through separate outlets, the ground lead closes a loop, and mains-frequency current in it adds hum that inflates Vpp and RMS readings. It matters most at millivolt levels. Power both from the same outlet strip, shorten the ground connection, and check how much hum remains with the probe tip shorted to its own ground.
Where to go next
Why Scope and Multimeter Voltage Readings Differ →
When the scope is right and simply measuring a different quantity than the meter.
How to Measure Voltage With an Oscilloscope →
The clean setup routine: channel, scale, coupling and measurements.
Why Does My Multimeter Show the Wrong Voltage? →
The same question for a handheld meter: loading, ranges, batteries and leads.