HOW-TO GUIDE
How to Compare Two Frequencies Using an Oscilloscope
By the OhmSavvy Research Team ·

Safety: both ground clips go to the same ground
- On a mains-powered bench scope, every channel's probe ground clip is connected to mains earth, and to each other. Clip both to the same circuit ground. A ground clip on any other point shorts it to earth.
- Never probe mains directly with standard probes to compare a frequency against the supply. Use a rated differential probe or a low-voltage transformer, and see how to measure mains frequency for the safe setup.
Three ways to compare two frequencies
Each method answers a slightly different question. Period measurement gives you two numbers you can write down. A Lissajous figure shows at a glance whether the ratio is an exact whole-number ratio like 1:2 or 2:3. Watching drift tells you how far apart two nearly identical frequencies are, often more finely than either period reading.
The core formula
All three need the signals on screen at the same time, which means a scope with at least two channels. They also assume each signal is steady enough to have a frequency. A signal that changes speed, such as a motor ramping up or a sweeping oscillator, gives a different answer every sweep; capture it in Single mode and measure the part you care about. If one signal is buried in noise, clean up the probing first, because a noisy edge makes both the trigger and the period reading jump around.
1Connect both signals and set each channel
Put the reference signal on CH1 and the signal under test on CH2, both probes on 10x with the channel attenuation set to match. Use DC coupling unless one signal rides on a large DC level. Set V/div on each channel so the trace fills about a third of the screen, then use each channel's vertical position to stack them, CH1 in the top half and CH2 in the bottom, so neither hides the other. Trigger on CH1 with an edge trigger at the middle of its swing; if the trace will not settle, see how to trigger an oscilloscope.
2Measure each period and convert to frequency
Set the timebase so the slower signal shows at least two full cycles. Count the divisions in one period of each trace, or better, across several periods, then multiply by the time/div.
Most digital scopes can also show the frequency of each channel automatically in the measure menu. Use it, but check one reading by hand: an auto measurement can lock onto noise or ringing and report a multiple of the real frequency. The frequency measurement guide covers that check in detail.
| Time/div | CH1 period | f1 | CH2 period | f2 | f2 ÷ f1 |
|---|---|---|---|---|---|
| 0.5 ms (figure) | 5 div = 2.5 ms | 400 Hz | 2.5 div = 1.25 ms | 800 Hz | 2 |
| 10 µs | 4 div = 40 µs | 25 kHz | 6 div = 60 µs | 16.67 kHz | ≈ 0.667 (2:3) |
| 1 µs | 2 div = 2 µs | 500 kHz | 8 div = 8 µs | 125 kHz | 0.25 (1:4) |
| 5 ms | 4 div = 20 ms | 50 Hz | 3.3 div = 16.5 ms | ≈ 60.6 Hz | ≈ 1.21 |
3Work out the ratio and what it means
Divide one frequency by the other. A clean whole-number result usually means one signal is derived from the other: a divide-by-two counter stage, a PLL multiplier, or a clock divided down for a peripheral. A ratio that is close to, but not exactly, a simple fraction usually means two independent sources that only happen to be similar, such as two crystal oscillators of the same nominal frequency.
A related check is whether the two signals stay locked. With CH1 triggered, a derived signal on CH2 stands perfectly still. An independent one slowly slides, even if its period reading looks identical. That movement is often a faster answer than any calculation.
4Read the ratio from a Lissajous figure
Most digital scopes offer an XY display mode, usually in the horizontal or display menu; check your manual for where yours keeps it. XY mode plots CH1 on the horizontal axis against CH2 on the vertical axis. Set both channels to similar V/div so the figure is roughly square and centred. With two sine waves in an exact ratio, the spot traces a closed, stationary figure whose shape gives the ratio.
The counting rule: count how many times the figure touches the top edge of its bounding box, and how many times it touches a side edge. Then f(CH2) ÷ f(CH1) = top touches ÷ side touches.
| f(CH2) : f(CH1) | Typical figure | Top touches | Side touches |
|---|---|---|---|
| 1 : 1 | Line, ellipse or circle, depending on phase | 1 | 1 |
| 2 : 1 | Figure eight lying on its side, like ∞ (a single arc at some phases) | 2 | 1 |
| 1 : 2 | Figure eight standing upright (a sideways arc at some phases) | 1 | 2 |
| 3 : 2 | Pretzel-like figure with three upper loops | 3 | 2 |
For a 1:1 ratio, the shape tells you the phase rather than the frequency; our phase difference guide shows those ellipses. Lissajous figures get hard to count above ratios of about 5:1, and they only stay still when the ratio is exact.
01
Reference on CH1
Known frequency, e.g. a generator
02
Unknown on CH2
Same ground, similar V/div
03
XY mode
CH1 horizontal, CH2 vertical
04
Adjust
Tune the reference until the figure stops
05
Count
Top ÷ side touches = ratio
Worked example: checking a clock divider
Suppose a board has a 1 MHz oscillator feeding a counter chip, and the counter's output should be the input divided by 8. Put the oscillator on CH1 and the counter output on CH2, trigger on CH2 rising, and set 1 µs/div so a whole output cycle fits on screen.
- CH1 shows one cycle per division: T1 = 1 µs, f1 = 1 MHz.
- CH2 shows one cycle in 8 divisions: T2 = 8 µs, f2 = 125 kHz.
- Ratio f1 ÷ f2 = 1 MHz ÷ 125 kHz = 8, so the divider is doing its job.
Now look at the timing as well as the count. In a working divider every CH2 edge sits a fixed, short delay after a CH1 edge, and both traces stand still together. If CH2 shows 7 or 9 input cycles in some periods, the counter is missing or gaining counts, often because of a noisy or slow input edge. If CH2 drifts against CH1 instead of standing still, it is not being clocked by that oscillator at all.
The same approach checks a PWM frequency against its timer clock, a UART baud clock against its crystal, or a microcontroller's clock output against the crystal driving it. For the edge-to-edge delay itself, see how to measure propagation delay.
When the two frequencies are nearly equal
Two frequencies a fraction of a percent apart give period readings that look the same. The difference shows up as drift instead. Trigger on CH1 and the CH2 trace slides along at the difference frequency: one full cycle of slip per 1 ÷ (f2 − f1) seconds. A 1000 Hz reference and a 1001 Hz signal slip one cycle per second; at 1000.1 Hz it takes ten seconds. Timing one complete slip with a stopwatch gives the difference directly.
The same idea works in XY mode: a nearly 1:1 pair makes an ellipse that slowly collapses to a line, opens into a circle and back, completing the sequence once per cycle of difference. If you add both signals with a math function, the sum swells and shrinks at the difference frequency too; that is the beat you hear when two notes are slightly out of tune.
How accurate is the comparison?
Reading divisions by eye is good to a few percent at best; cursors and auto measurements do better, and measuring across several cycles improves either. Because both channels share one timebase, a small timebase error affects both readings equally and largely cancels in the ratio, which is why a two-channel comparison is often more trustworthy than either absolute number. The scope's timebase accuracy is given on its datasheet, usually in parts per million.
For absolute accuracy, a dedicated frequency counter is the better tool. Signals also need to sit well inside the scope's bandwidth to keep a clean shape; see what oscilloscope bandwidth means. To compare timing and amplitude rather than frequency, see how to compare input and output signals, and for checking a clock source itself, see how to check a crystal oscillator.
Which scope you need to compare frequencies
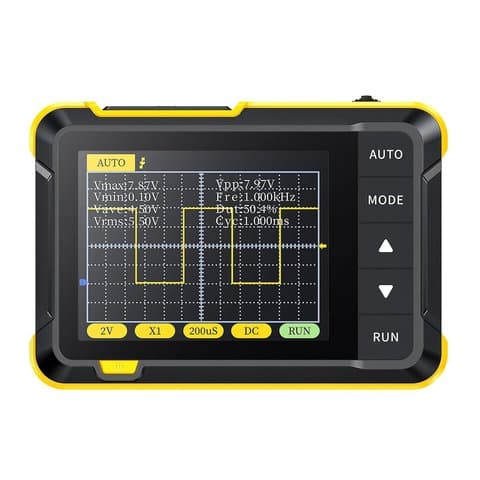
You need at least two channels. A single-channel handheld can measure each frequency in turn but cannot show them together or use XY mode. Any two- or four-channel bench scope in our best beginner oscilloscopes roundup will do the job; confirm XY mode in its manual if you plan to use Lissajous figures.
Multi-channel scopes in our reviews
100MHz, 2 channels, 1 GSa/s; an oscilloscope and waveform generator in one unit.
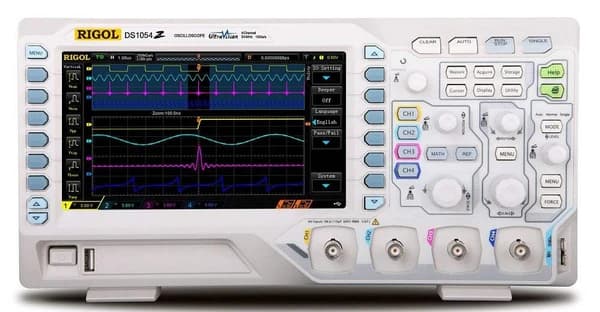
50MHz, 4 channels, 1 GSa/s; the default beginner recommendation for years.
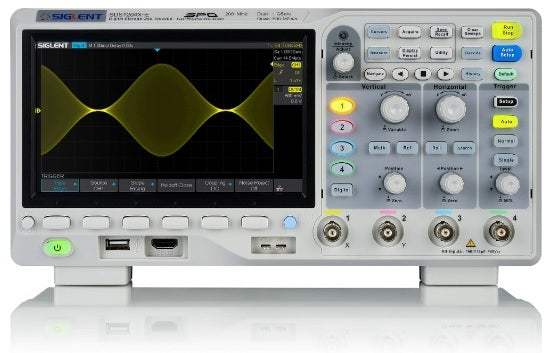
100MHz, 4 channels, 1 GSa/s; more bandwidth than the Rigol, for projects that will get more demanding.
As an Amazon Associate I earn from qualifying purchases. Prices and availability are shown on Amazon.
Frequently asked questions
Can a single-channel oscilloscope compare two frequencies?
Only one at a time. You can measure the first signal, write down its frequency, then move the probe and measure the second. That works for steady signals, but you cannot see their timing relationship, use XY mode, or watch one drift against the other. For those you need at least two channels.
Why does my Lissajous figure keep rotating?
Because the two frequencies are not in an exact whole-number ratio. The figure cycles through its shapes once for every cycle of difference between them, so for a near 1:1 pair, a pattern that repeats once a second means the frequencies differ by about 1 Hz. A slower roll means they are closer to the exact ratio.
Which channel should I trigger on when comparing frequencies?
Trigger on the signal you treat as the reference, usually the input or the known-good source. That trace stands still and the other one shows any difference as movement. If you trigger on the wrong one, the reference appears to drift instead, which can confuse which signal is changing.
Can I compare a sine wave with a square wave?
Yes. Period measurement does not care about wave shape, so measure each with edge triggering and cursors or the automatic frequency reading. Lissajous figures still show the ratio by their repeat count, but the shapes have sharp corners and flat sides instead of smooth loops, which makes them harder to read.
Can I use the FFT function to compare two frequencies?
Yes, and it helps when signals are noisy or contain several tones. The FFT shows each frequency as a peak along a horizontal frequency axis, so two signals appear as two peaks whose positions you can read with cursors. Its resolution depends on the sample rate and record length, so close frequencies can merge into one peak. For a precise ratio, period measurement is usually better.