HOW-TO GUIDE
How to Use Oscilloscope Bandwidth Measurement for an Amplifier
By the OhmSavvy Research Team ·

Safety and load: protect the amplifier and the scope
- Power amplifiers should drive a resistive dummy load of the rated impedance and power, not a speaker, during a sweep. A sweep through high frequencies at full level can damage tweeters and an open output can upset some amplifiers.
- Many audio amplifiers use bridged (BTL) outputs where neither speaker terminal is ground. The scope's ground clip is tied to mains earth, so clipping it to either terminal can short the output. Measure each side to ground on two channels, or use a differential probe.
- Stay on the low-voltage signal side of mains-powered equipment and keep within the voltage ratings of the probes and inputs.
What amplifier bandwidth means
Most amplifiers have a flat midband region where gain is steady, a low-frequency roll-off caused by coupling capacitors, and a high-frequency roll-off caused by the transistors, the feedback network and stray capacitance. The lower cutoff fL and upper cutoff fH are the frequencies where gain is 3 dB below midband. A DC-coupled amplifier has no lower cutoff, so its bandwidth is simply fH.
The rule for every reading
1Check the scope and probes have far more bandwidth
Your scope is a low-pass filter too. At its own rated bandwidth it shows a sine at about 70.7% of its true size, so if the scope and amplifier roll off in the same region you measure both at once and the cutoff comes out too low. The common rule is scope and probe bandwidth of 3 to 5 times the highest frequency you need to measure, as explained in what oscilloscope bandwidth means.
| Expected amplifier fH | Scope bandwidth at 3x | Scope bandwidth at 5x |
|---|---|---|
| 20 kHz (audio) | 60 kHz | 100 kHz |
| 1 MHz | 3 MHz | 5 MHz |
| 10 MHz | 30 MHz | 50 MHz |
| 30 MHz | 90 MHz | 150 MHz |
Use the probes on 10x, since many probes have much less bandwidth on 1x, and compensate them. Switch off the channel bandwidth limit (often 20MHz) if your sweep goes into the megahertz range. For audio amplifiers almost any bench scope has bandwidth to spare.
2Connect the generator, amplifier and load
Connect the generator to the amplifier input and put CH1 on the input pin, not just the generator terminal, so you see the actual signal the amplifier receives. Put CH2 on the output across the load. Both ground clips go to the amplifier's signal ground. Trigger on CH1. Measuring the input directly matters because many generators droop at high frequencies or when loaded, and that droop would otherwise look like amplifier roll-off.
3Set a midband reference
Pick a frequency in the flat region, such as 1 kHz for audio. Set the input so the output is clearly undistorted, around half of its maximum swing, then read Vpp on both channels with the Measure menu or cursors. That ratio is your 0 dB reference. Write the input level down and keep it constant through the sweep.
4Sweep the frequency and find the −3 dB points
Step the generator upwards, adjusting the timebase to keep two or three cycles on screen, and read Vin and Vout at each step. If Vin has changed, use the ratio rather than Vout alone. When the ratio drops near 0.707 of midband, take smaller steps until you find where it crosses. That is fH. Go back to midband and repeat downwards to find fL. Averaging or the RMS measurement steadies small readings at the ends of the sweep. As you approach each cutoff the output also shifts in time relative to the input; for a simple single-pole roll-off it is about 45° at the −3 dB point, which you can check with our phase difference guide.
Worked example: an audio amplifier stage
These are illustrative readings for a gain-of-10 stage with 0.2 Vpp input, chosen to show how the numbers fall: midband output 2 Vpp, so the −3 dB target is 2 × 0.707 ≈ 1.41 Vpp.
| Frequency | Vout (Vpp) | Ratio to midband | Relative gain |
|---|---|---|---|
| 10 Hz | 0.89 | 0.447 | −7.0 dB |
| 20 Hz | 1.41 | 0.707 | −3.0 dB (fL) |
| 100 Hz | 1.96 | 0.981 | −0.2 dB |
| 1 kHz | 2.00 | 1.000 | 0 dB (reference) |
| 10 kHz | 1.98 | 0.992 | −0.1 dB |
| 50 kHz | 1.70 | 0.848 | −1.4 dB |
| 80 kHz | 1.41 | 0.707 | −3.0 dB (fH) |
| 200 kHz | 0.74 | 0.371 | −8.6 dB |
Measuring this stage needs very little scope bandwidth: at 3–5x of 80 kHz, anything above about 400 kHz is enough, so a 50MHz or 100MHz bench scope reads it with negligible error.
Read the shape of the curve, not just two numbers
Plot your readings on a log frequency axis and the shape tells you more about the amplifier than fL and fH alone. A simple single-pole roll-off falls at about 6 dB per octave (20 dB per decade) once you are well past the cutoff. In the example, going from 80 kHz to 200 kHz, a factor of 2.5, takes the gain from −3 dB to −8.6 dB, close to what that slope predicts for a point just past the corner. A steeper fall suggests more than one pole, for example two stages that each roll off in the same region.
A rise in gain just before the roll-off, called peaking, is a warning sign. It often goes with overshoot and ringing on square waves, and in feedback amplifiers it can mean the stage is close to oscillating. If you see it, feed in a square wave and look at the edges, as described in how to measure overshoot and ringing. A dip in the middle of the band usually points to a fault or a deliberate tone-control or filter network. Measure again at a lower level as well: a real small-signal response stays the same when you halve the input, while clipping and slew effects change with level.
Avoid clipping and slew-rate limiting
A bandwidth sweep is a small-signal measurement. If the output flattens at the tops, the gain reading is wrong at every frequency; reduce the input until the sine is clean, and check with how to find signal clipping. Also make sure the trace fits on the screen, since a waveform running off the top is clipped by the scope rather than the amplifier.
At high frequencies a large output can also hit the amplifier's slew-rate limit, the fastest its output can change. The sine then turns into a triangle and the amplitude drops, which looks like roll-off but depends on level. A sine needs a slew rate of 2π × f × Vpeak: 10 V peak at 80 kHz needs about 5 V/µs. If halving the input changes where the gain falls off, you were seeing slew limiting, not small-signal bandwidth.
Which scope you need for amplifier bandwidth
Two channels and a sine source are the essentials, and bandwidth headroom over the amplifier's fH is what keeps the result honest. Compare options in our best beginner oscilloscopes roundup.
Bench scopes in our reviews
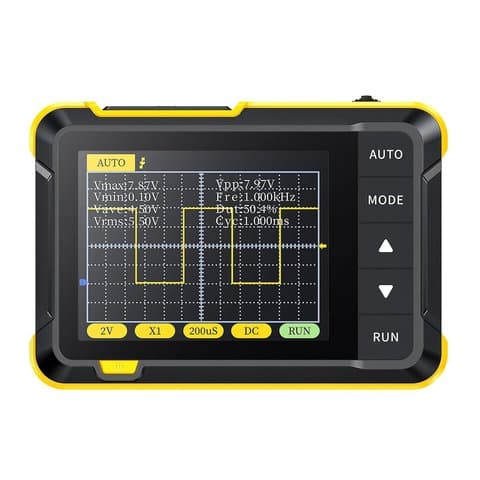
100MHz, 2 channels, 1 GSa/s; an oscilloscope and waveform generator in one unit.
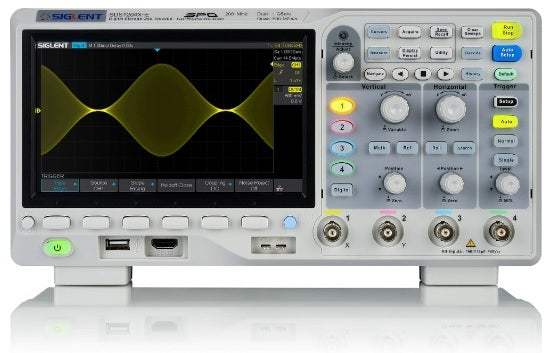
100MHz, 4 channels, 1 GSa/s; for projects that will get more demanding.
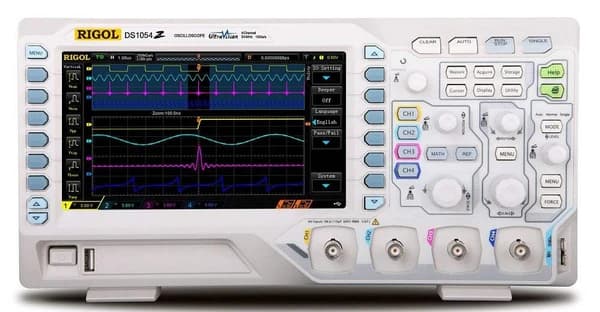
50MHz, 4 channels, 1 GSa/s; the default beginner recommendation for years.
As an Amazon Associate I earn from qualifying purchases. Prices and availability are shown on Amazon.
Frequently asked questions
Why is the -3 dB point used to define bandwidth?
At −3 dB the output voltage is 0.707 of its midband value, which means the output power has halved. It is a convention used across amplifiers, filters and oscilloscopes, so figures from different datasheets can be compared. Some audio specs quote −1 dB or −0.5 dB limits instead, which give a narrower range, so always note which limit a figure uses.
Can I measure amplifier bandwidth with a square wave?
You can estimate it. Feed a clean square wave and measure the output's 10-90% rise time; for an amplifier that behaves like a single-pole low-pass, bandwidth is roughly 0.35 divided by rise time. A sine sweep is more direct and also shows the low-frequency cutoff, peaking or dips, which a single rise-time number cannot.
Do I need a signal generator with a sweep function?
No. A sweep function speeds things up, but stepping the frequency by hand and reading the output at each step works fine and lets you slow down near the cutoff. What matters more is a clean sine whose amplitude you can see on CH1, so any droop from the generator is visible and does not get mistaken for amplifier roll-off.
How many frequency points should I measure?
Three to five points per decade, such as 10, 20, 50 and 100 Hz, give a usable curve. Add extra points around each cutoff until you bracket the frequency where the gain crosses 0.707. On a log frequency axis the points then spread evenly, which makes the roll-off slope easy to see when you plot them.
How does amplifier bandwidth relate to an op amp's gain-bandwidth product?
For a voltage-feedback op amp, closed-loop bandwidth is roughly the gain-bandwidth product divided by the noise gain. A part rated at 1 MHz GBW set for a gain of 10 should reach about 100 kHz. That is only an estimate: layout, load and slew-rate limits often pull the real -3 dB point lower, which is why the measured sweep is the figure to trust.